

Morro Bay Fish Counts
Recent sportfishing catch counts from Morro Bay charter boats, by landing and boat. See the statewide fish counts, this city’s charter boats & landings, Morro Bay fish reports, California fishing seasons, or the species guides.
Morro Bay Fish Counts, Fri, Oct 16
On Fri, Oct 16, Morro Bay boats reported 420 fish: 2 boats, 36 anglers. Rockfish led with 226, then bocaccio (71).
Both boats fished out of Morro Bay Landing; see the Morro Bay Landing fish counts for every boat.
That was the best rockfish day of the week. Best per angler: the Avenger at 13.2 fish per angler.
Over the last 7 days (through October 17, 2026), Morro Bay charter boats reported 900 fish across 1 landing and 3 boats.
Morro Bay fish counts by landing
1 reporting, most fish first- 3 boats · 5 trips
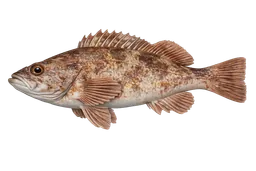
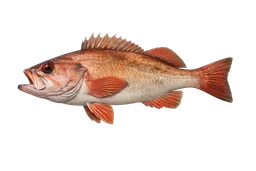
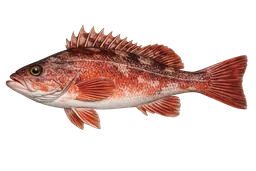
Species by Day
| Species | Total | |||||||
|---|---|---|---|---|---|---|---|---|
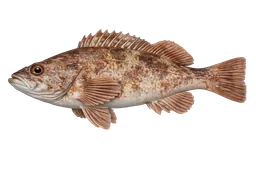
| Rockfish | 54 | 200 | 65 | 226 | 545 | |||
| Bocaccio | 6 | 49 | 71 | 126 | ||||
| Red Rockfish | 6 | 5 | 25 | 63 | 99 | |||
| Copper Rockfish | 9 | 15 | 16 | 30 | 70 | |||
| Lingcod | 3 | 9 | 16 | 26 | 54 | |||
| Mako Shark | 3 | 3 | ||||||
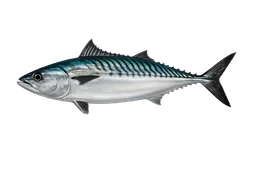
| Bonito | 2 | 2 | ||||||
| Ocean Whitefish | 1 | 1 | ||||||
| Trips | 1 | 1 | 1 | 2 | 5 |
Oct 11–17: 900 fish. Same dates last year: 2,175 fish (-59%).
Recent Trips 5 trips

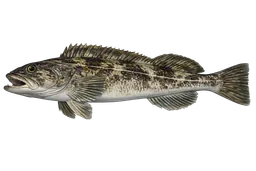
- Oct 15, 2026 · 3/4 Day · 171 fish

- Oct 12, 2026 · 3/4 Day · 80 fish
- Oct 16, 2026 · 3/4 Day · 249 fish

- Oct 16, 2026 · Full Day · 171 fish
See live counts & set bite alerts
The website shows recent counts. Get real-time updates and biting intel in the app.


Morro Bay Fish Counts by Year
Fish City records for Morro Bay begin May 2023. Through October 17, 2026 they show 356,850 fish across 2,183 reported trips.
| Year | Fish | Trips | Top species | ||||||||||||||||||||||||||||||
|---|---|---|---|---|---|---|---|---|---|---|---|---|---|---|---|---|---|---|---|---|---|---|---|---|---|---|---|---|---|---|---|---|---|
| 2026(through Oct 17) | 72,031 fish | 366 trips | Monthly totals, 2026
| ||||||||||||||||||||||||||||||
| 2025 | 102,195 fish | 610 trips | Monthly totals, 2025
| ||||||||||||||||||||||||||||||
| 2024 | 80,398 fish | 567 trips | Monthly totals, 2024
| ||||||||||||||||||||||||||||||
| 2023 | 102,226 fish | 640 trips | Monthly totals, 2023
|
Trips are the fishing sessions reported to Fish City for this city.