
California Fishing Seasonality
When California charter boats actually landed each species, derived from 2023–2025 California charter dock reports — not a promised or predicted season. This is a record of what boats caught, never a guarantee of what's legal to keep; always check current CDFW regulations before you fish.
Updated
What's landing right now
Species by Sep catch share
Each chart is fish landed per month by California charter boats: 2025 in full as the shaded line, 2026 to date as the bold line. The bars underneath are the 2023–2025 share of annual catch.
- 2025 full season
- 2026 through Aug(totals counted through Sep 22)
- Hover or tap a month for the numbers.
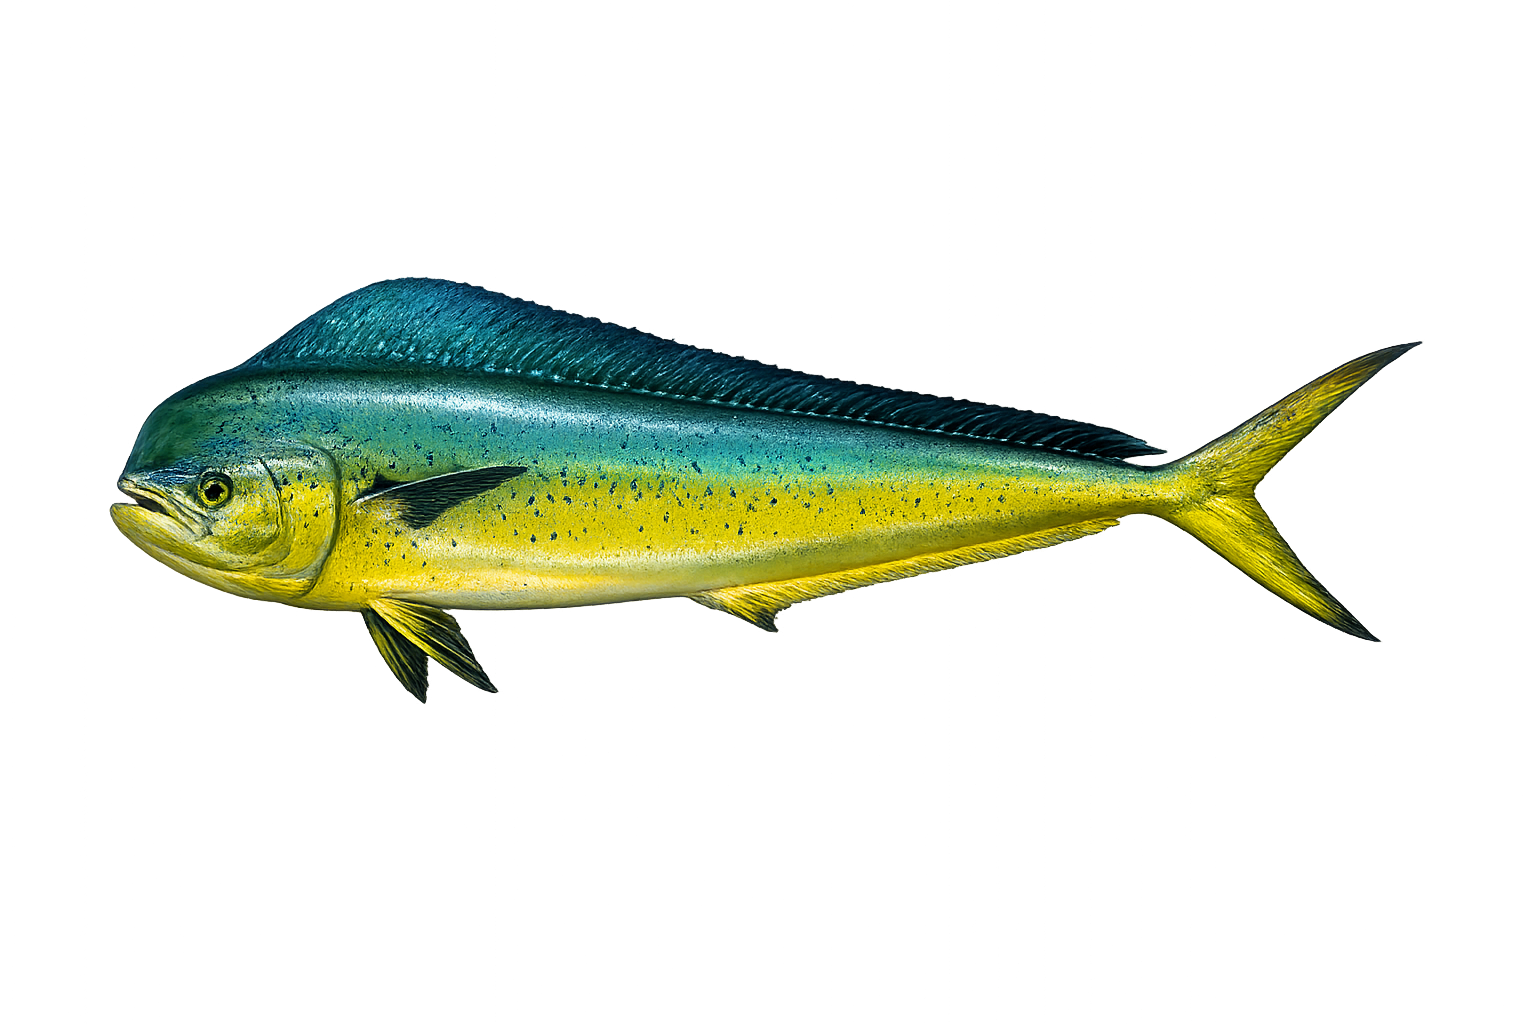
Dorado (Mahi-Mahi): fish landed by month, 2025 versus 2026 so far. 2025 peak October, 138 fish.
- 2025
- 276 fish
- 2026 so far
- 9,648 fish
Peak: Sep (53.3%) · Core months: Aug–Oct · Sample: 32,064 fish landed over 3 years
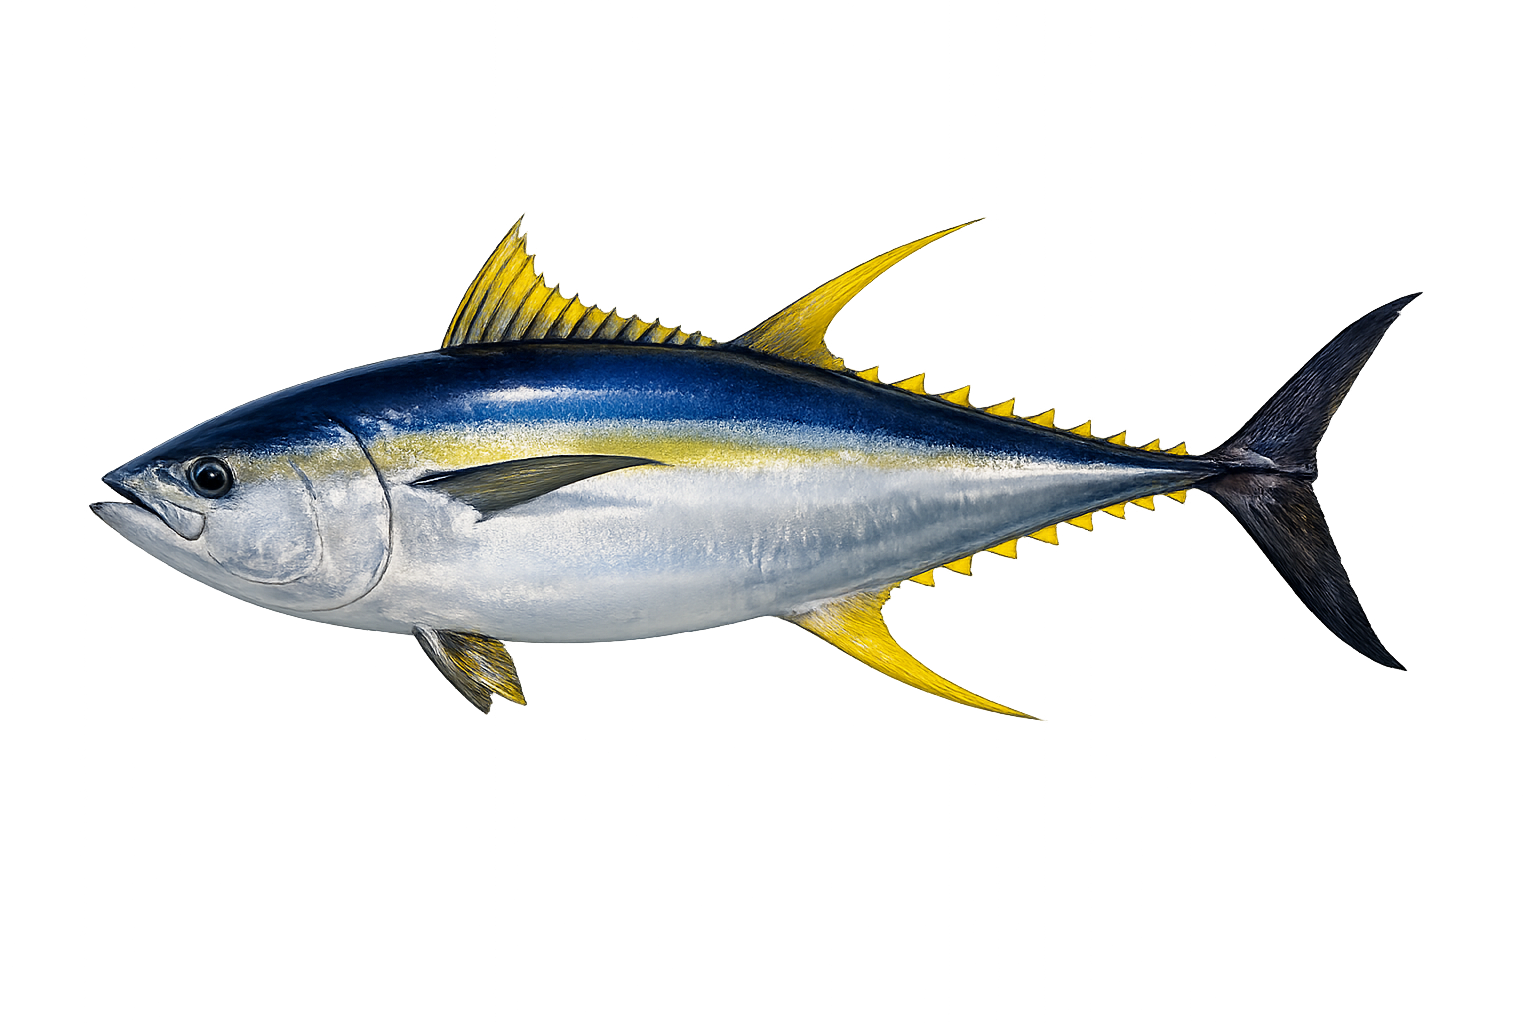
Yellowfin Tuna: fish landed by month, 2025 versus 2026 so far. 2025 peak September, 4,561 fish.
- 2025
- 6,613 fish
- 2026 so far
- 36,623 fish
Peak: Sep (44.2%) · Core months: Sep–Oct · Sample: 36,233 fish landed over 3 years
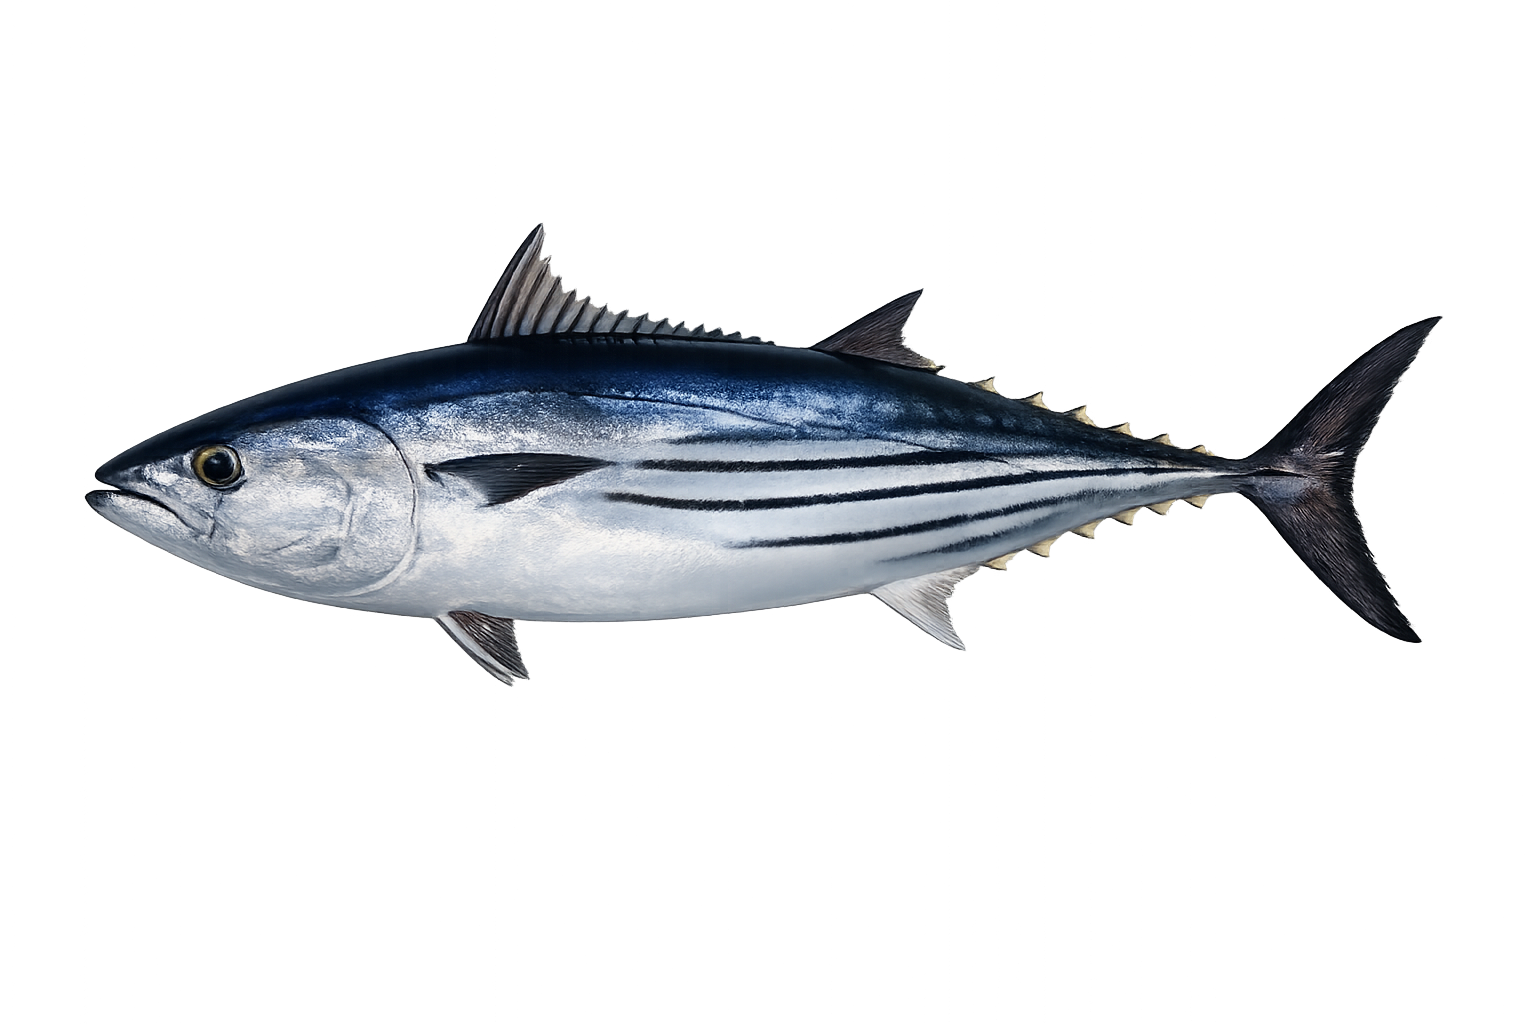
Skipjack Tuna: fish landed by month, 2025 versus 2026 so far. 2025 peak September, 333 fish.
- 2025
- 569 fish
- 2026 so far
- 4,885 fish
Peak: Sep (43.5%) · Core months: Sep–Nov · Sample: 833 fish landed over 3 years
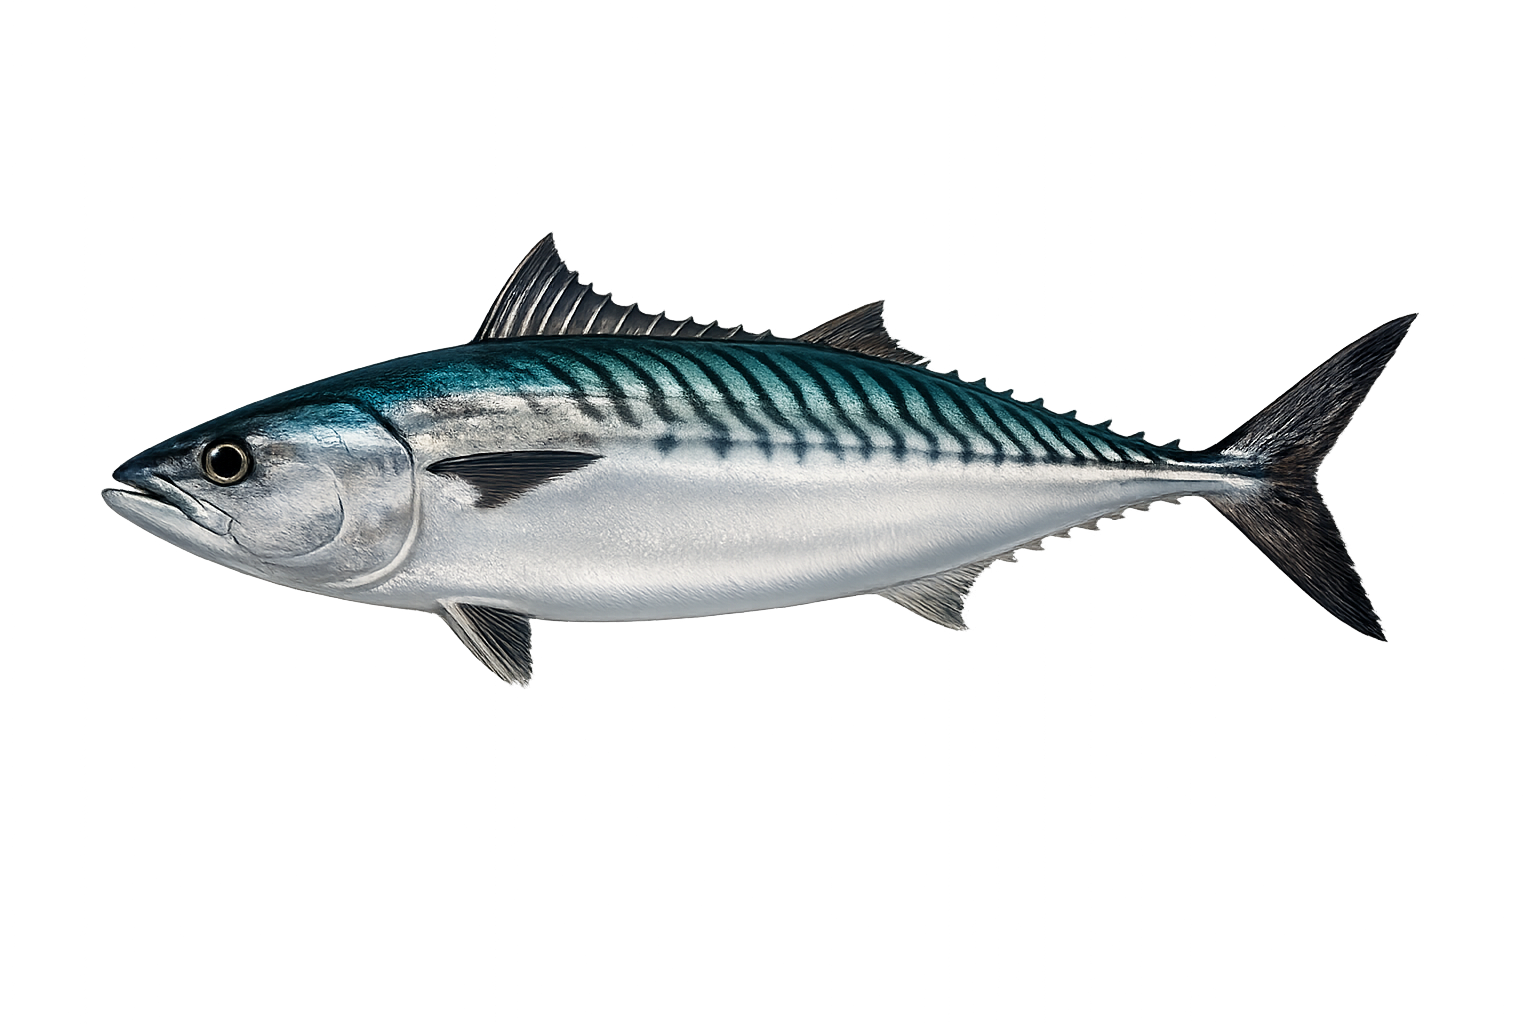
Pacific Bonito: fish landed by month, 2025 versus 2026 so far. 2025 peak December, 11,193 fish.
- 2025
- 33,399 fish
- 2026 so far
- 104,361 fish
Peak: Sep (24.5%) · Core months: May–Oct · Sample: 71,625 fish landed over 3 years
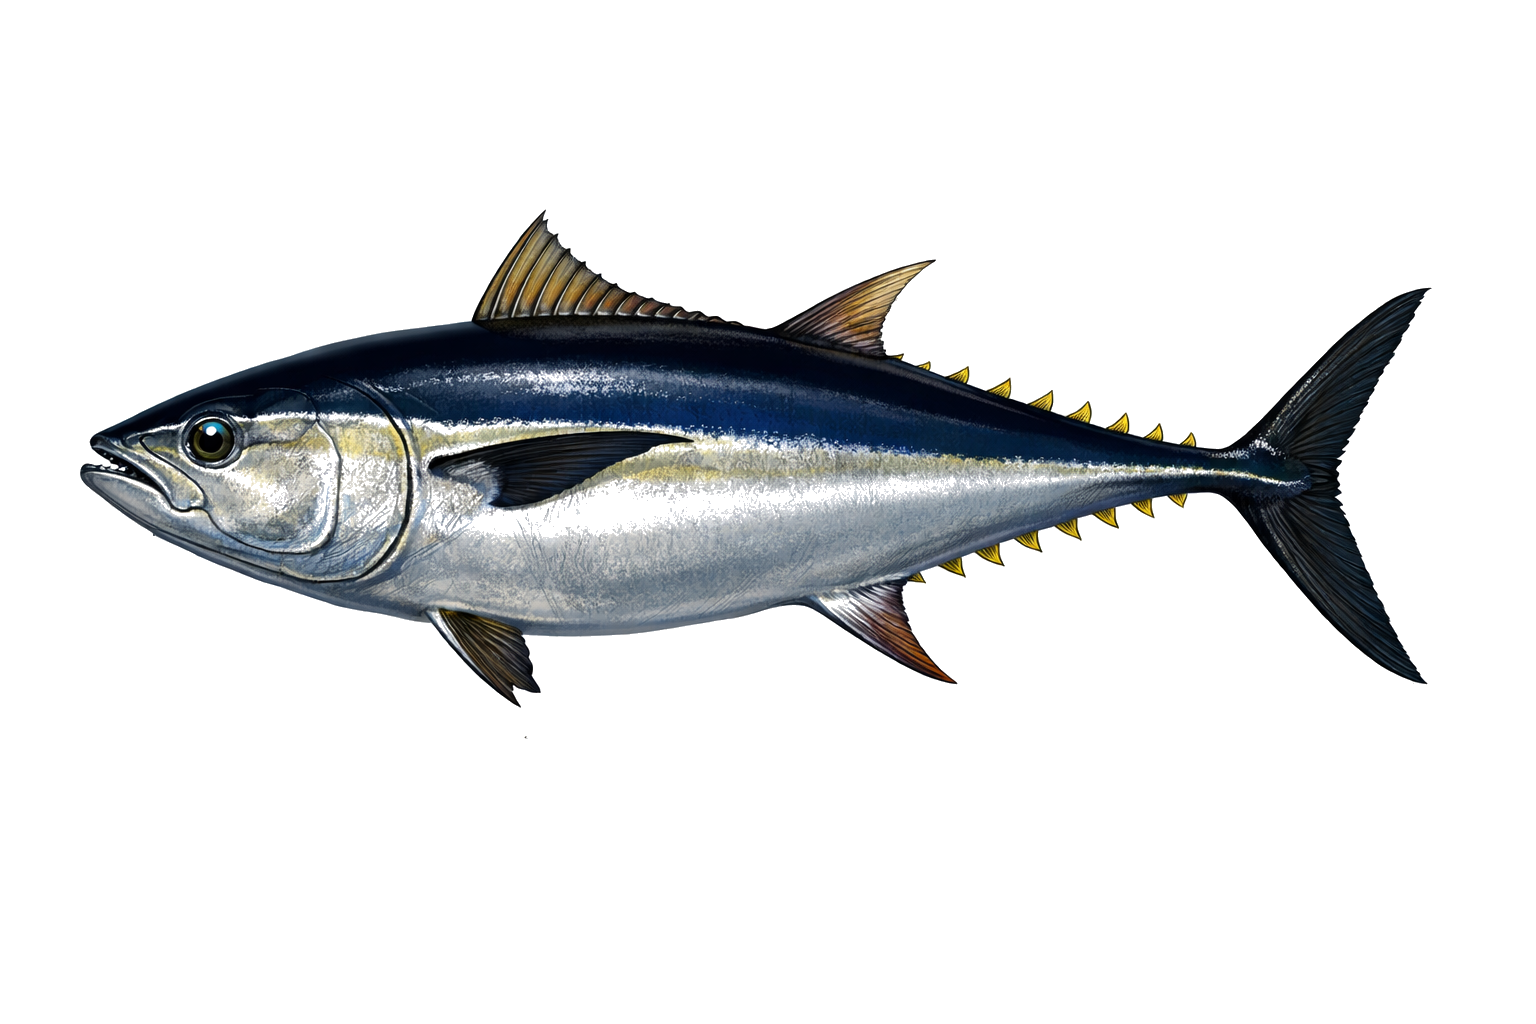
Bluefin Tuna: fish landed by month, 2025 versus 2026 so far. 2025 peak September, 11,820 fish.
- 2025
- 55,013 fish
- 2026 so far
- 32,359 fish
Peak: Sep (23.3%) · Core months: May–Oct · Sample: 179,082 fish landed over 3 years
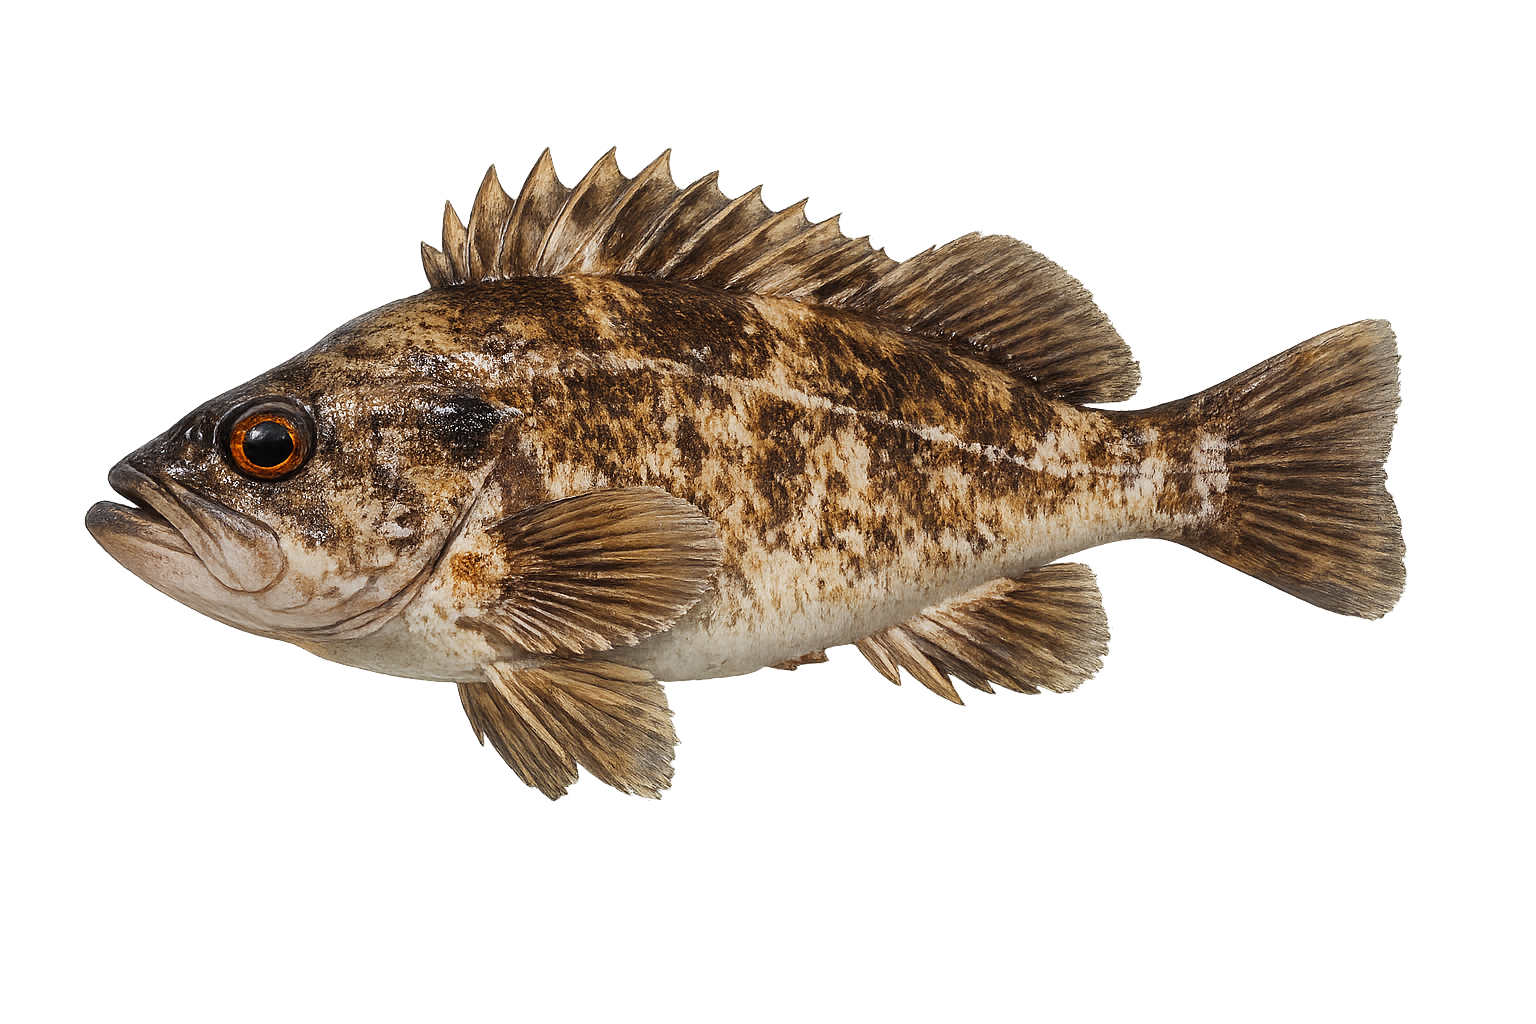
Brown Rockfish: fish landed by month, 2025 versus 2026 so far. 2025 peak July, 1,403 fish.
- 2025
- 5,036 fish
- 2026 so far
- 1,988 fish
Peak: Jul (31.2%) · Core months: May–Sep · Sample: 10,695 fish landed over 3 years
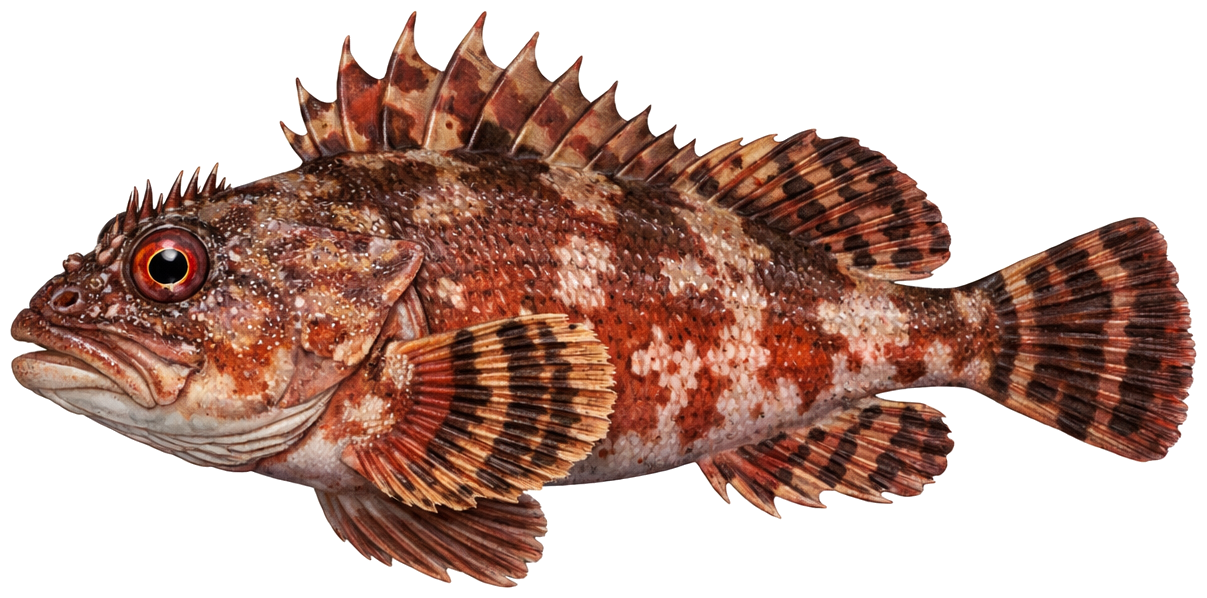
Cabezon: fish landed by month, 2025 versus 2026 so far. 2025 peak August, 212 fish.
- 2025
- 1,058 fish
- 2026 so far
- 1,145 fish
Peak: Jul (23%) · Core months: May–Sep · Sample: 1,994 fish landed over 3 years
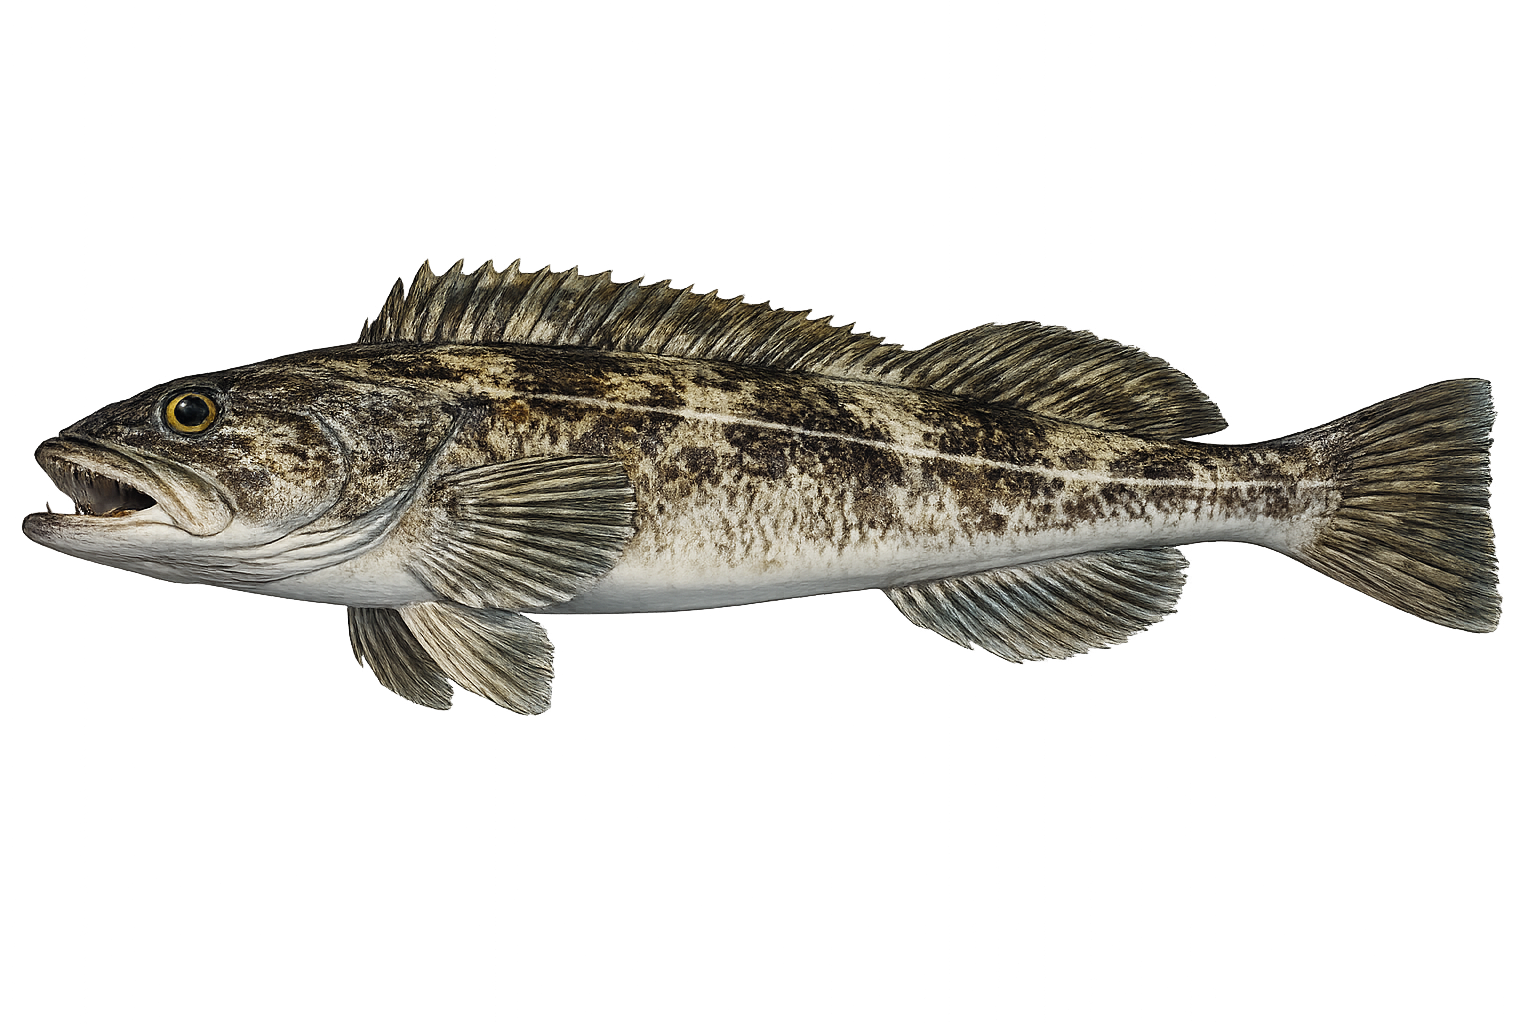
Lingcod: fish landed by month, 2025 versus 2026 so far. 2025 peak August, 5,437 fish.
- 2025
- 28,658 fish
- 2026 so far
- 17,578 fish
Peak: Aug (21.2%) · Core months: Apr–Dec · Sample: 64,452 fish landed over 3 years
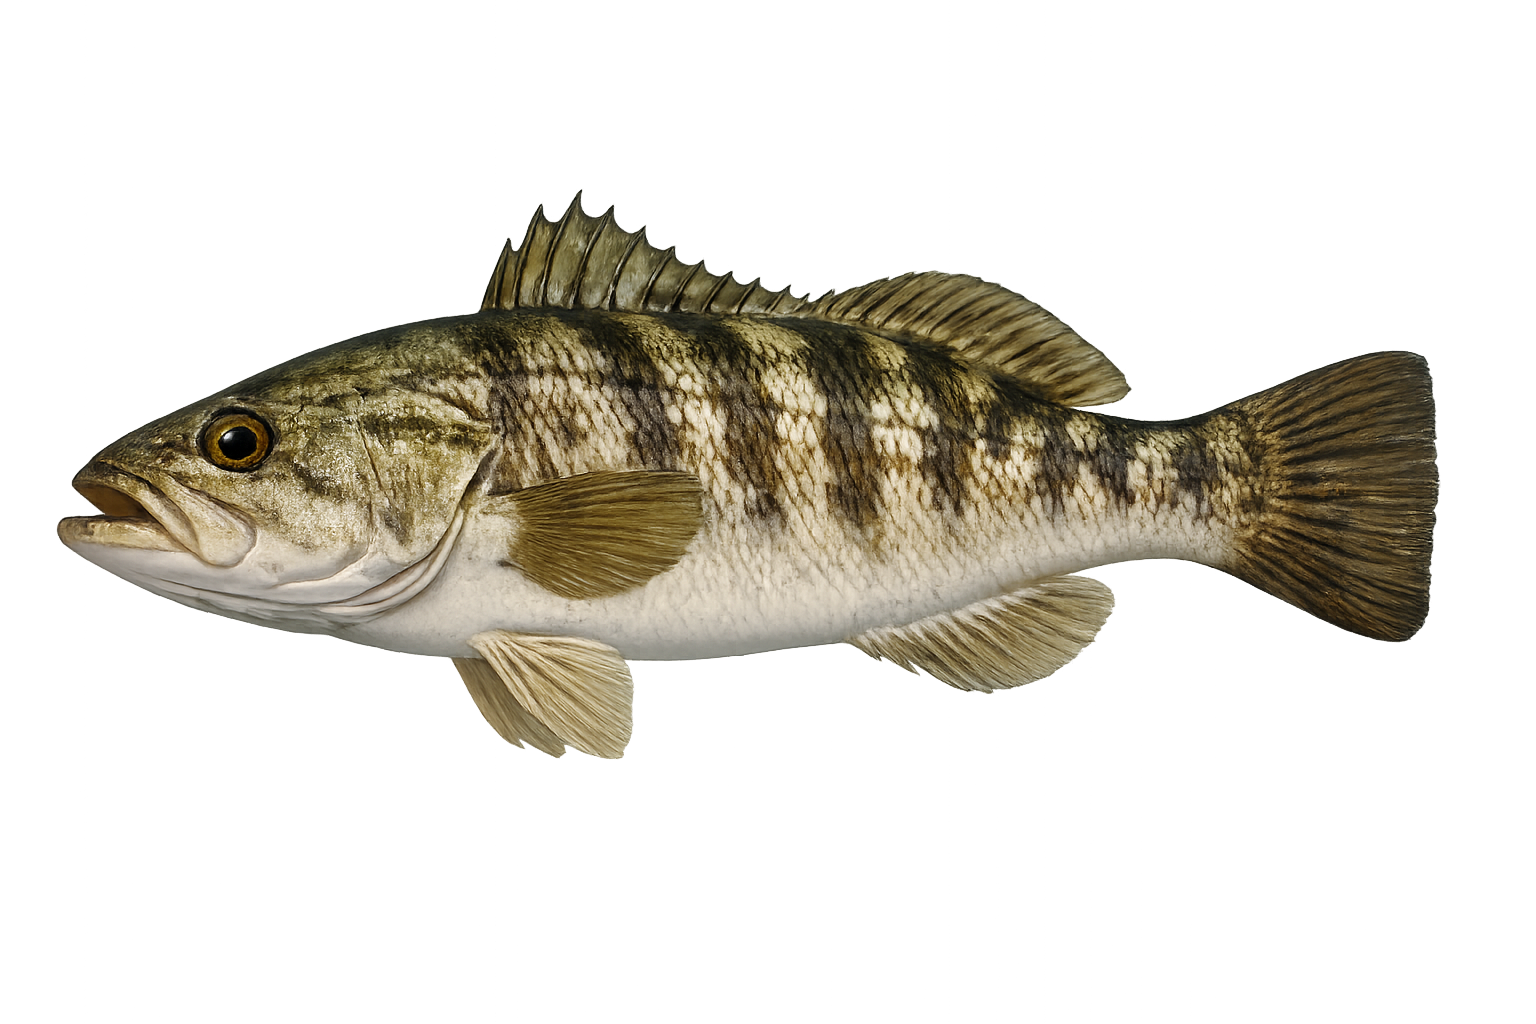
Calico Bass: fish landed by month, 2025 versus 2026 so far. 2025 peak June, 42,075 fish.
- 2025
- 152,361 fish
- 2026 so far
- 217,913 fish
Peak: Jul (25%) · Core months: May–Sep · Sample: 419,415 fish landed over 3 years
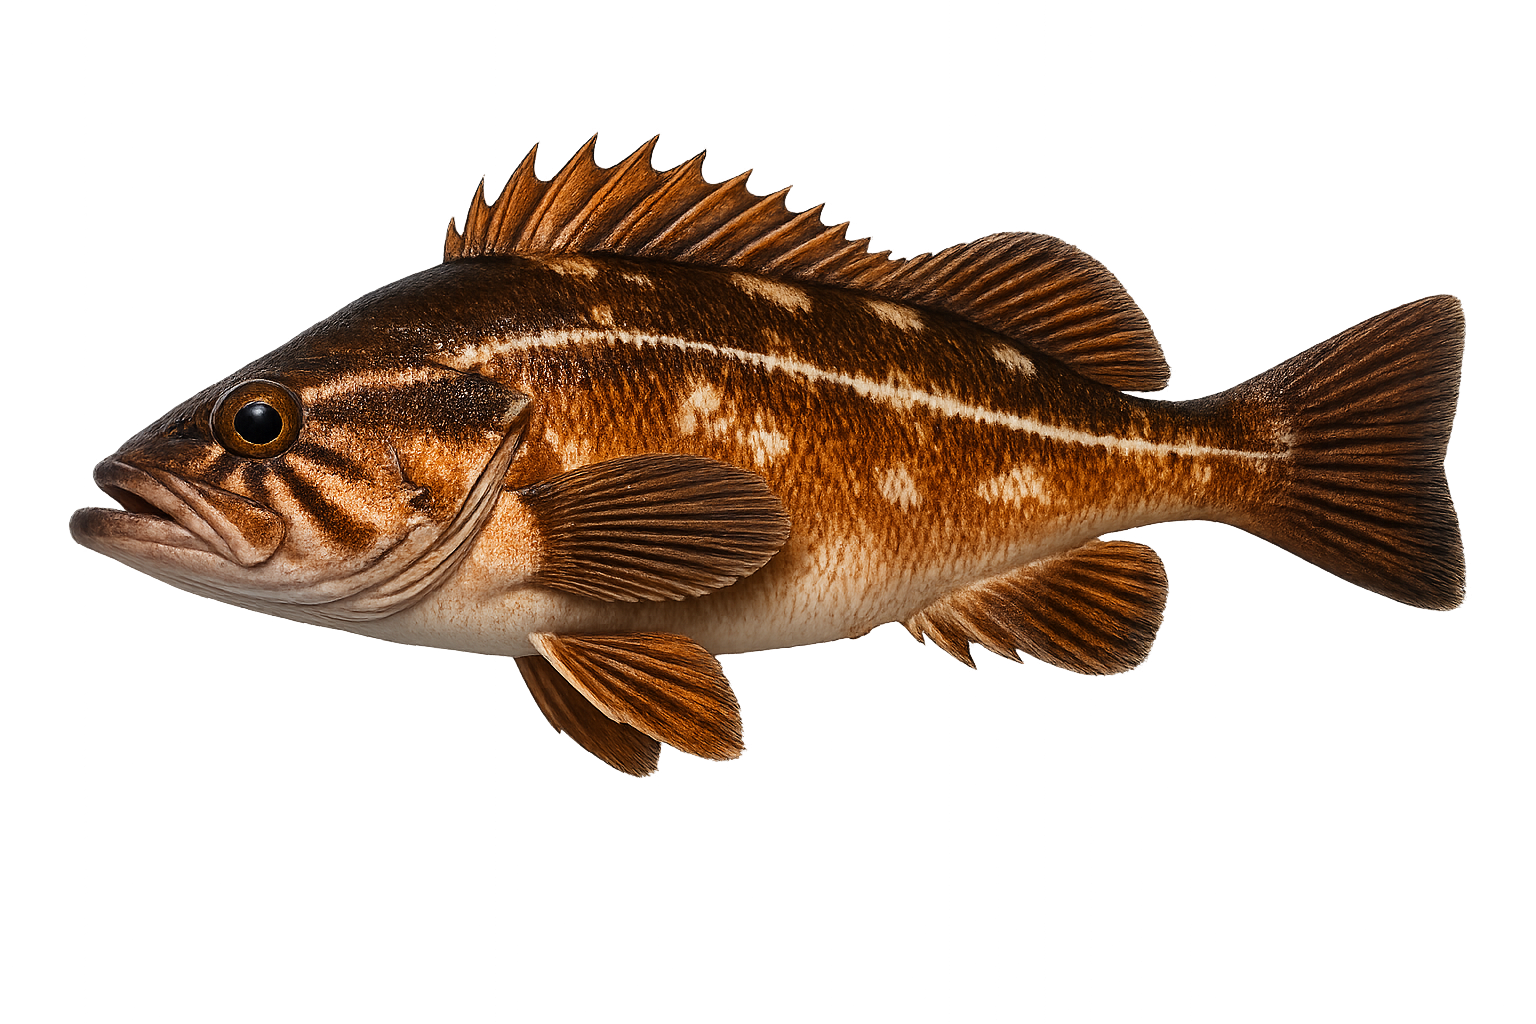
Copper Rockfish: fish landed by month, 2025 versus 2026 so far. 2025 peak July, 595 fish.
- 2025
- 3,367 fish
- 2026 so far
- 3,302 fish
Peak: Jul (19.7%) · Core months: Apr–Dec · Sample: 4,368 fish landed over 3 years
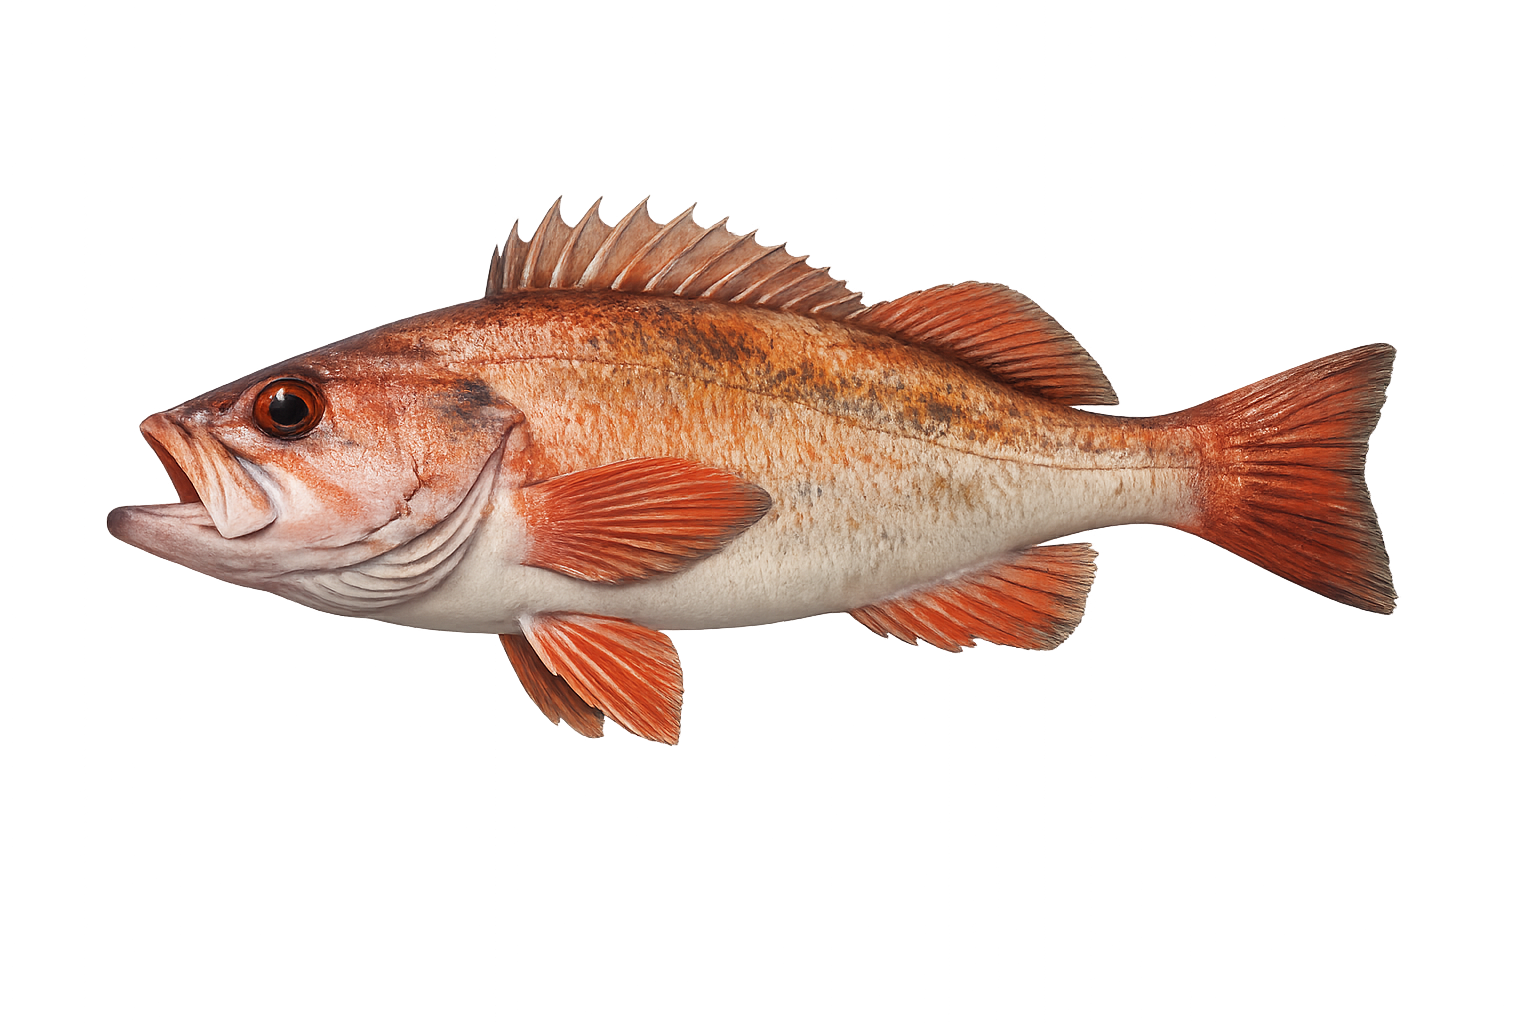
Bocaccio: fish landed by month, 2025 versus 2026 so far. 2025 peak May, 2,726 fish.
- 2025
- 15,143 fish
- 2026 so far
- 9,429 fish
Peak: May (18.5%) · Core months: Apr–Nov · Sample: 61,354 fish landed over 3 years
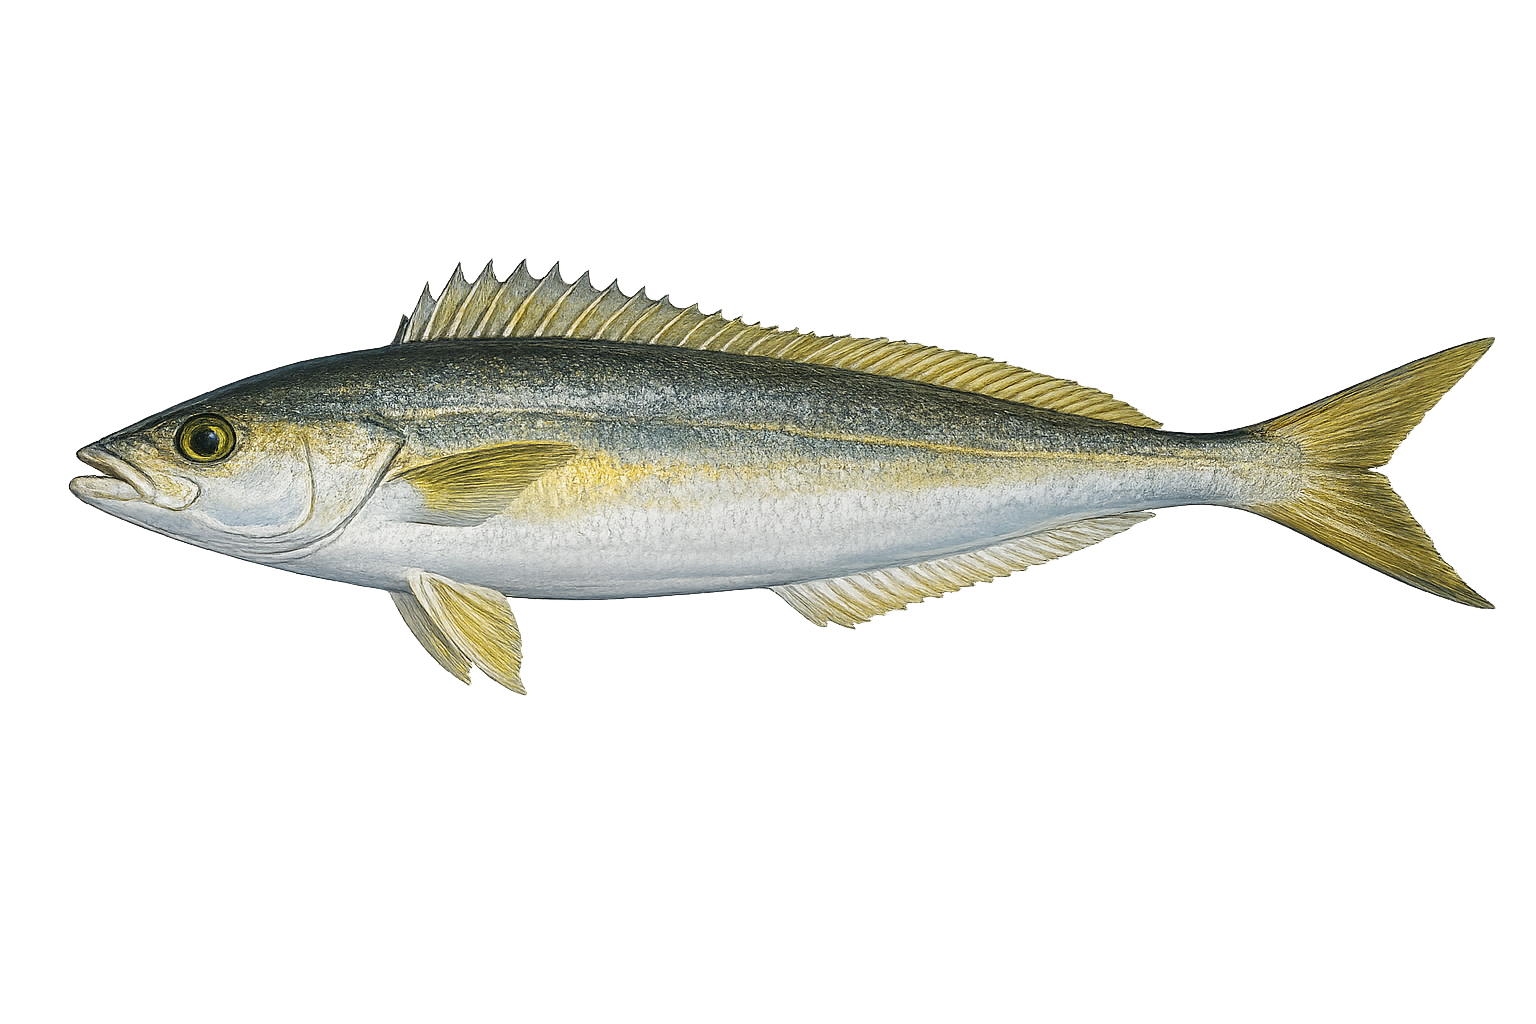
Ocean Whitefish: fish landed by month, 2025 versus 2026 so far. 2025 peak August, 34,198 fish.
- 2025
- 185,822 fish
- 2026 so far
- 222,556 fish
Peak: Sep (12.7%) · Core months: Mar–Dec · Sample: 527,415 fish landed over 3 years
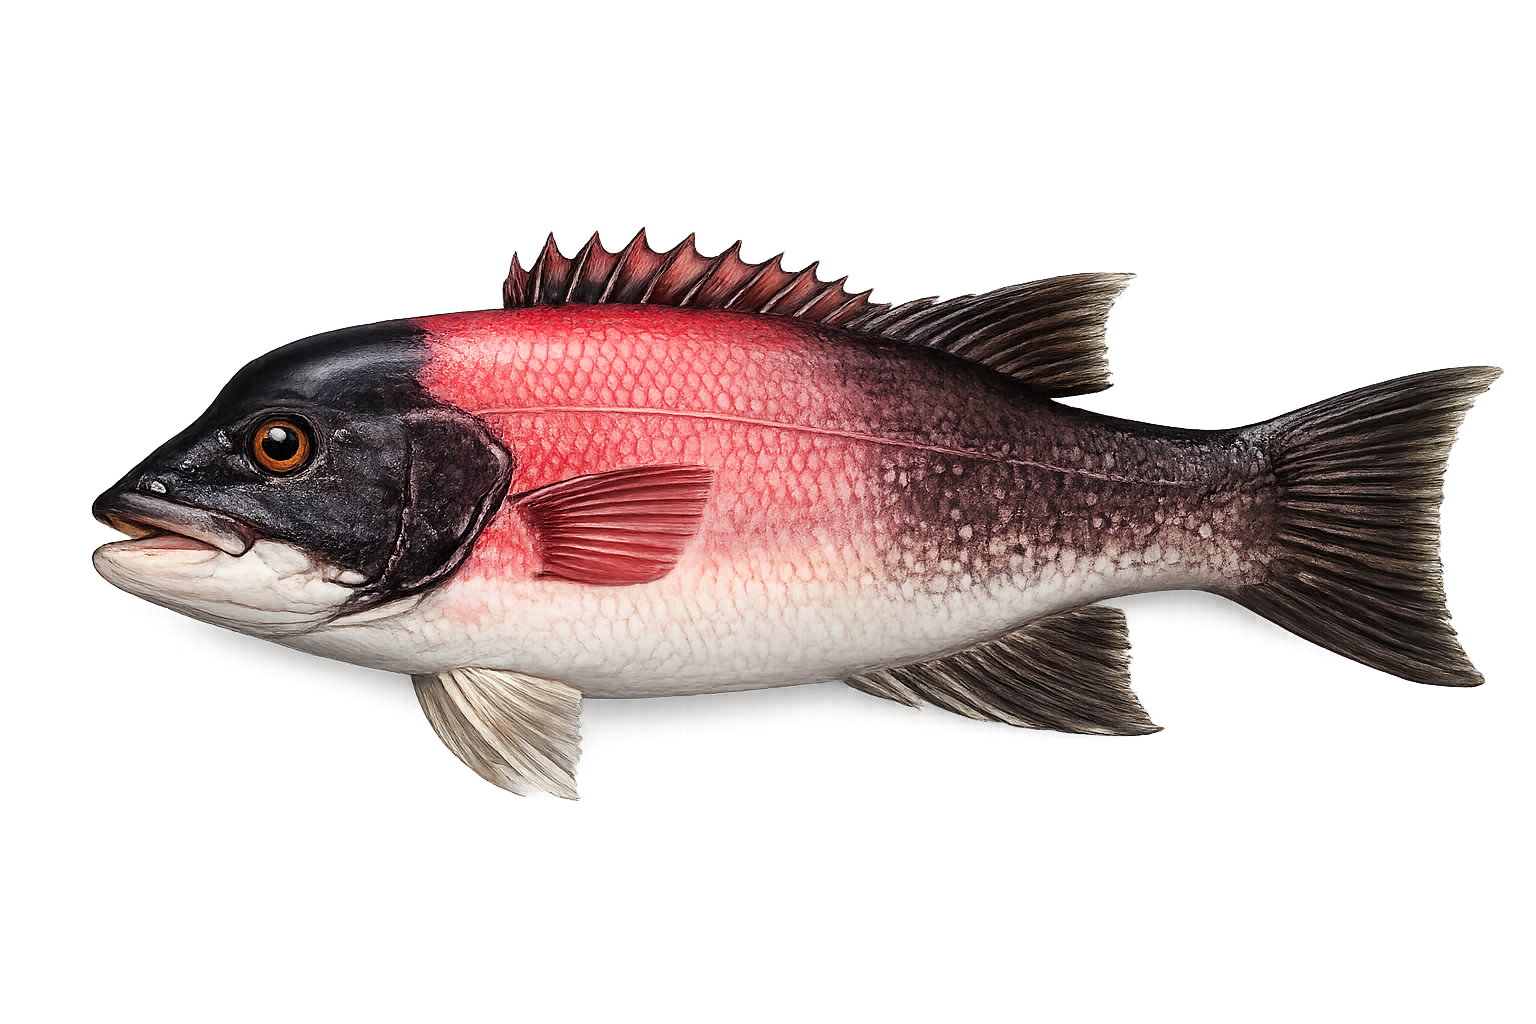
California Sheephead: fish landed by month, 2025 versus 2026 so far. 2025 peak August, 3,601 fish.
- 2025
- 22,715 fish
- 2026 so far
- 24,910 fish
Peak: Jul (14%) · Core months: Mar–Dec · Sample: 64,084 fish landed over 3 years
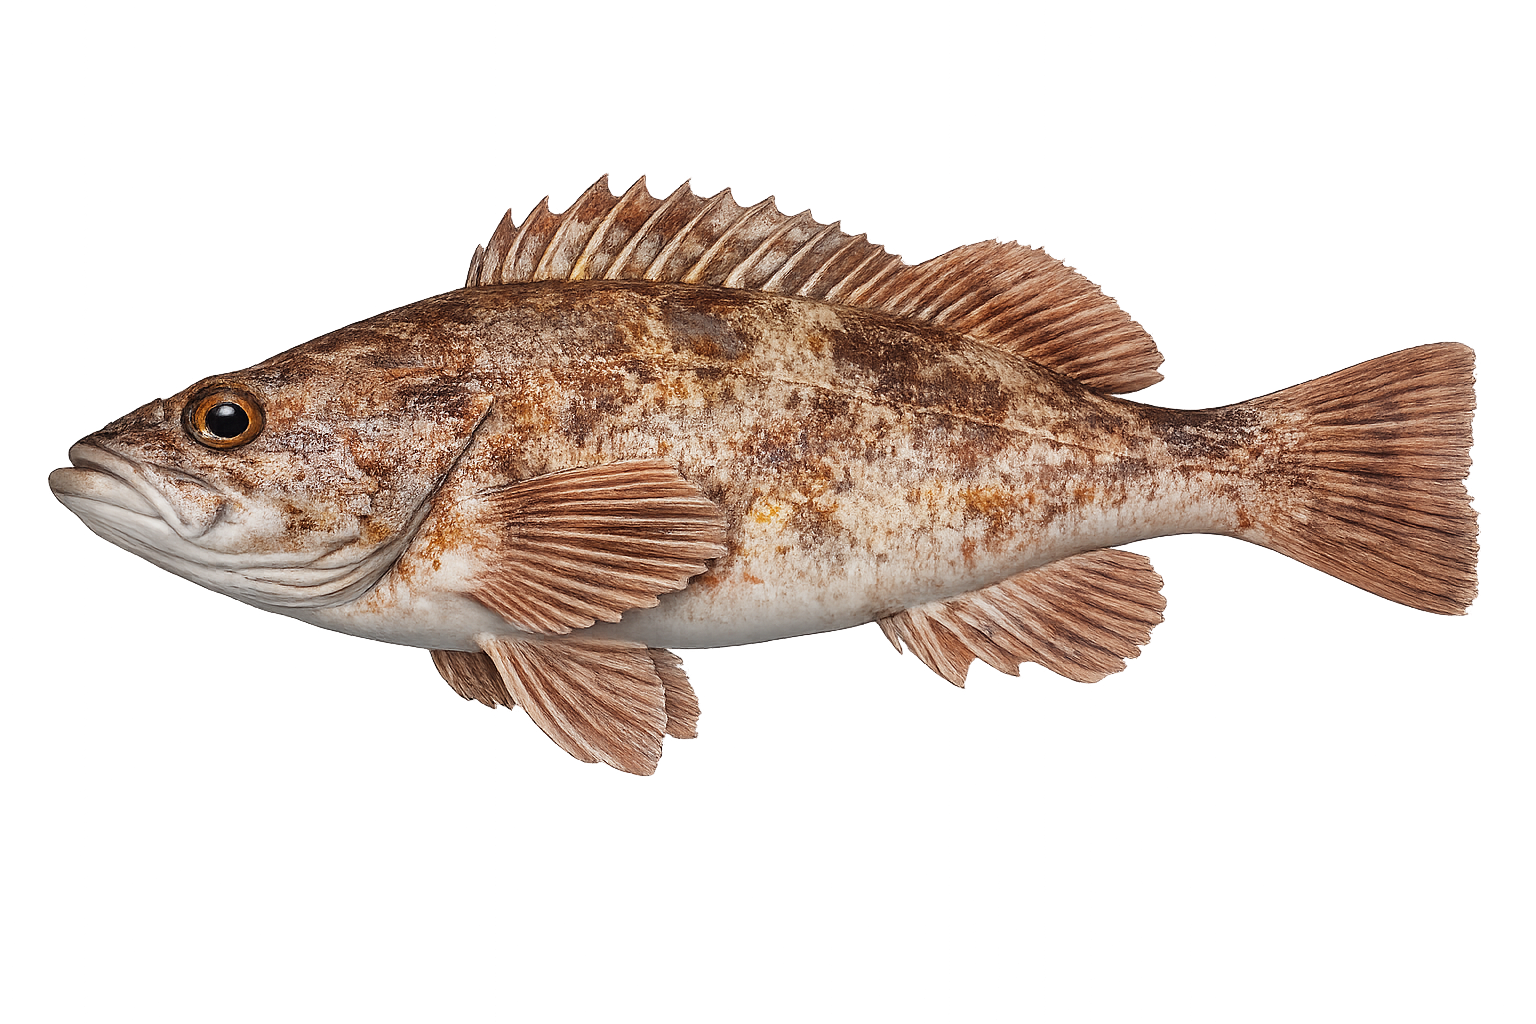
Rockfish: fish landed by month, 2025 versus 2026 so far. 2025 peak April, 100,919 fish.
- 2025
- 786,084 fish
- 2026 so far
- 521,242 fish
Peak: Jun (12.5%) · Core months: Apr–Dec · Sample: 2,246,973 fish landed over 3 years
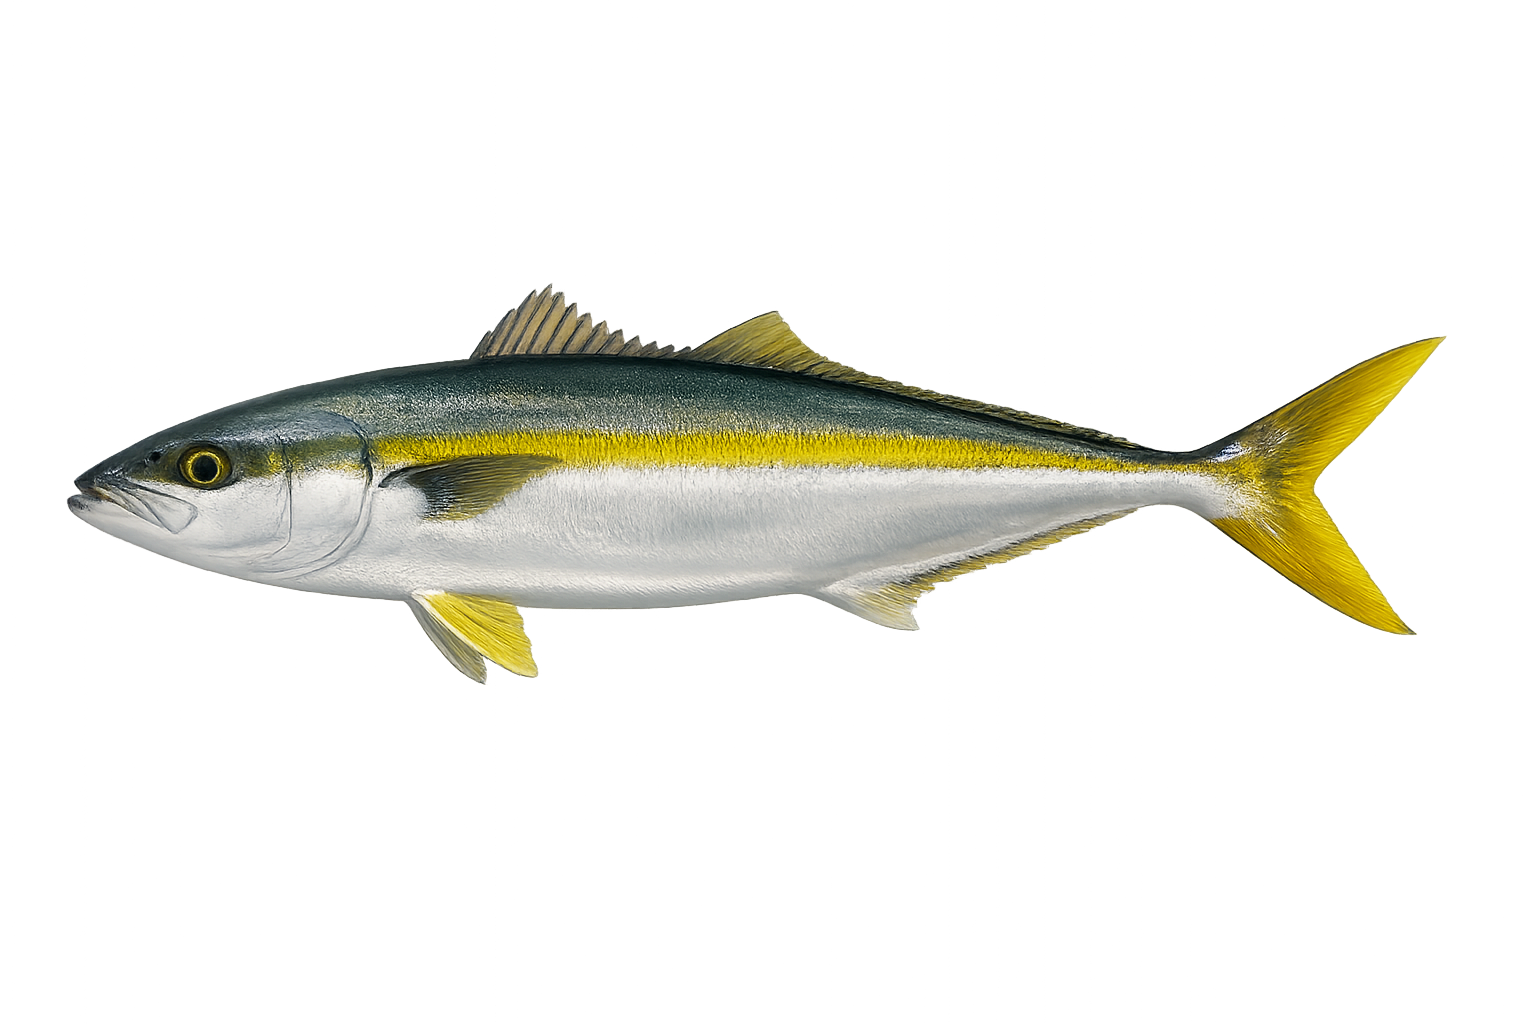
Yellowtail: fish landed by month, 2025 versus 2026 so far. 2025 peak August, 7,435 fish.
- 2025
- 23,131 fish
- 2026 so far
- 57,285 fish
Peak: Aug (34.6%) · Core months: May–Oct · Sample: 75,241 fish landed over 3 years
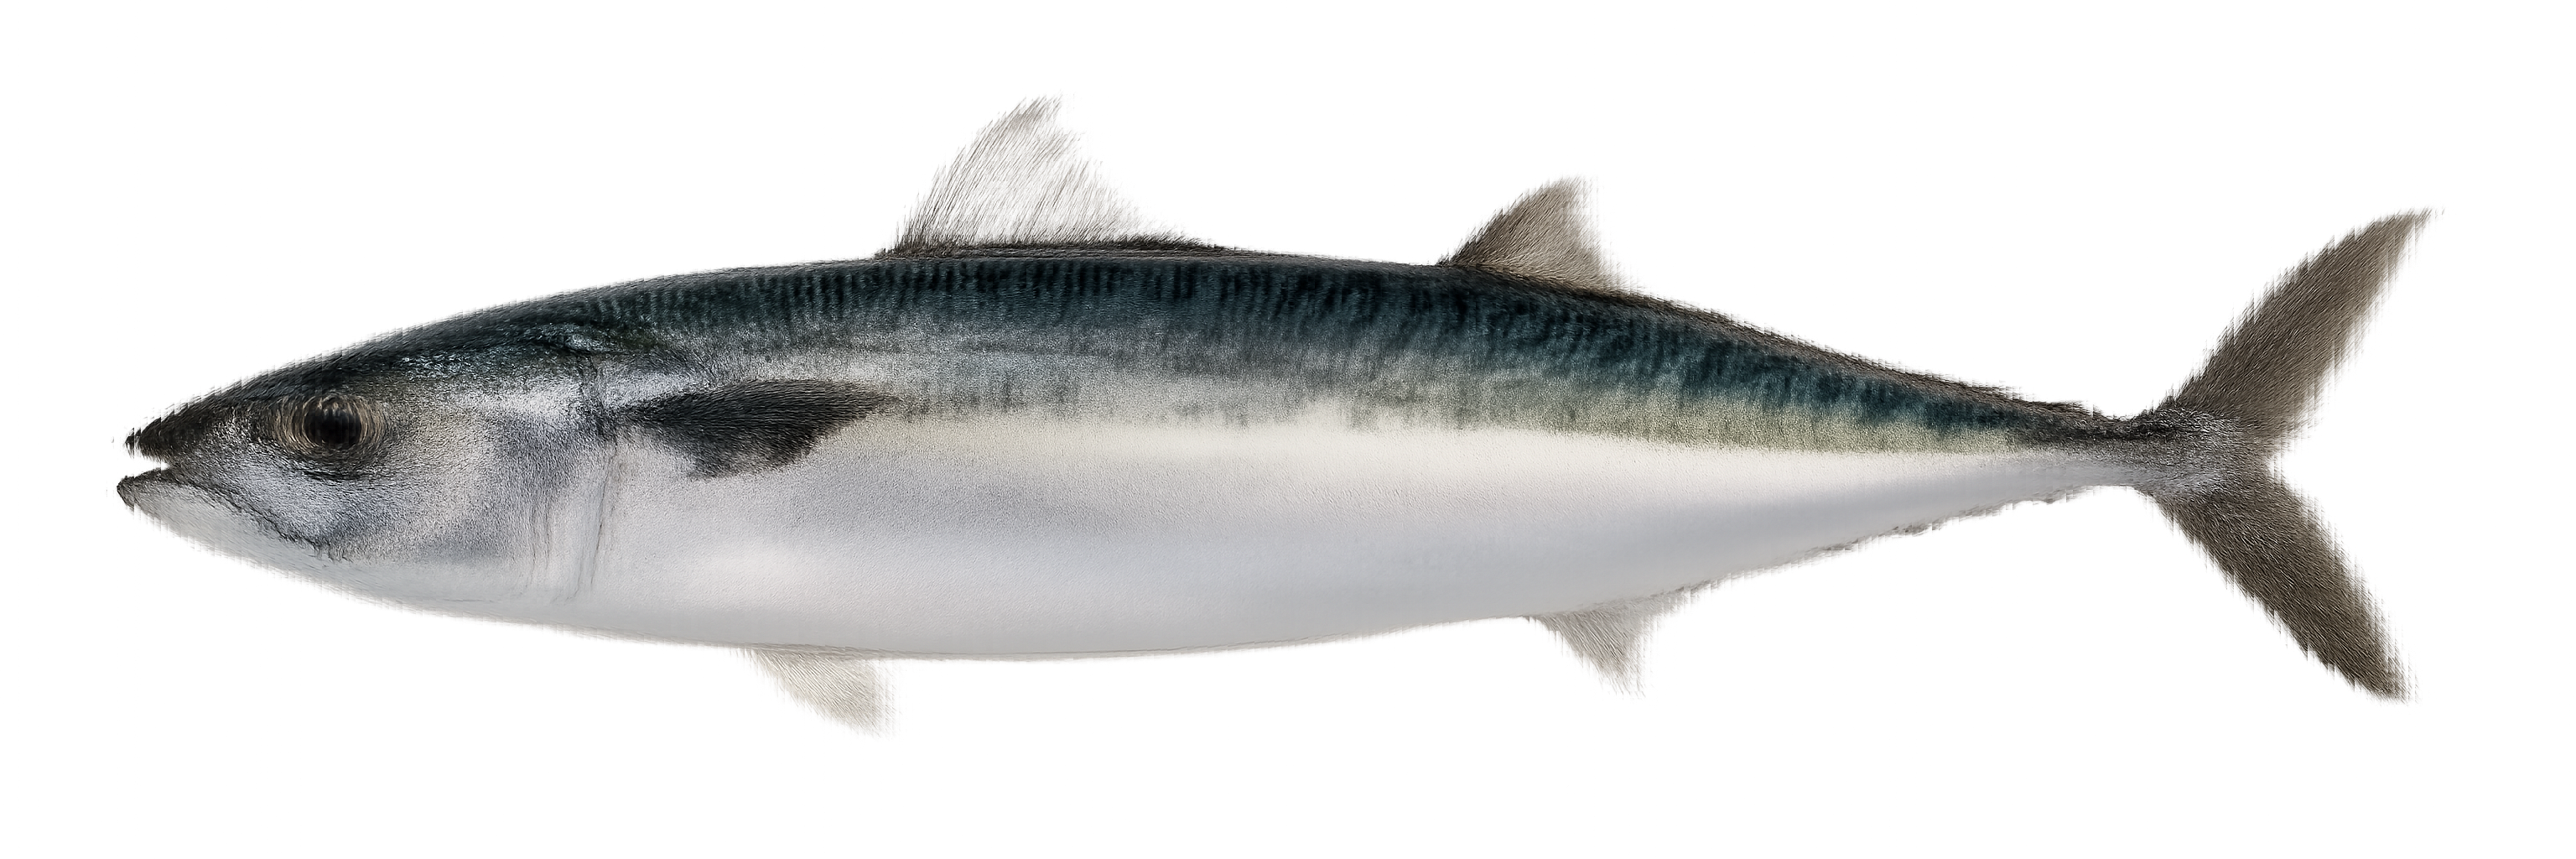
Pacific Mackerel: fish landed by month, 2025 versus 2026 so far. 2025 peak August, 392 fish.
- 2025
- 1,071 fish
- 2026 so far
- 201 fish
Peak: Jul (20.1%) · Core months: May–Nov · Sample: 7,118 fish landed over 3 years
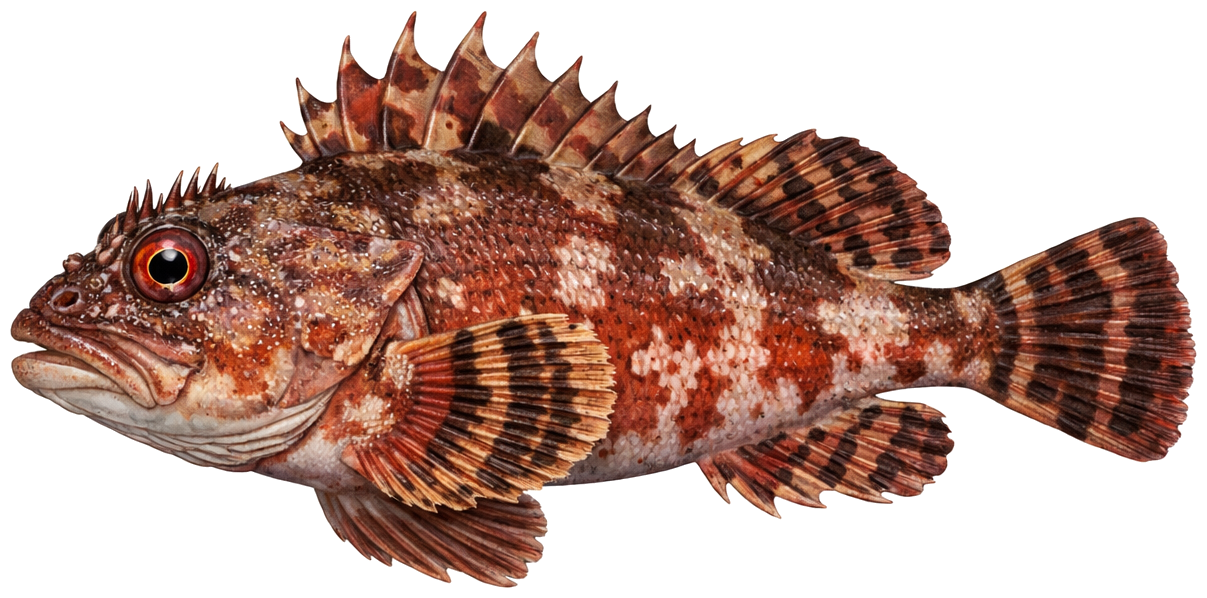
Sculpin (California Scorpionfish): fish landed by month, 2025 versus 2026 so far. 2025 peak June, 23,734 fish.
- 2025
- 182,595 fish
- 2026 so far
- 120,874 fish
Peak: Jun (14.2%) · Core months: Jan–Dec · Sample: 456,573 fish landed over 3 years
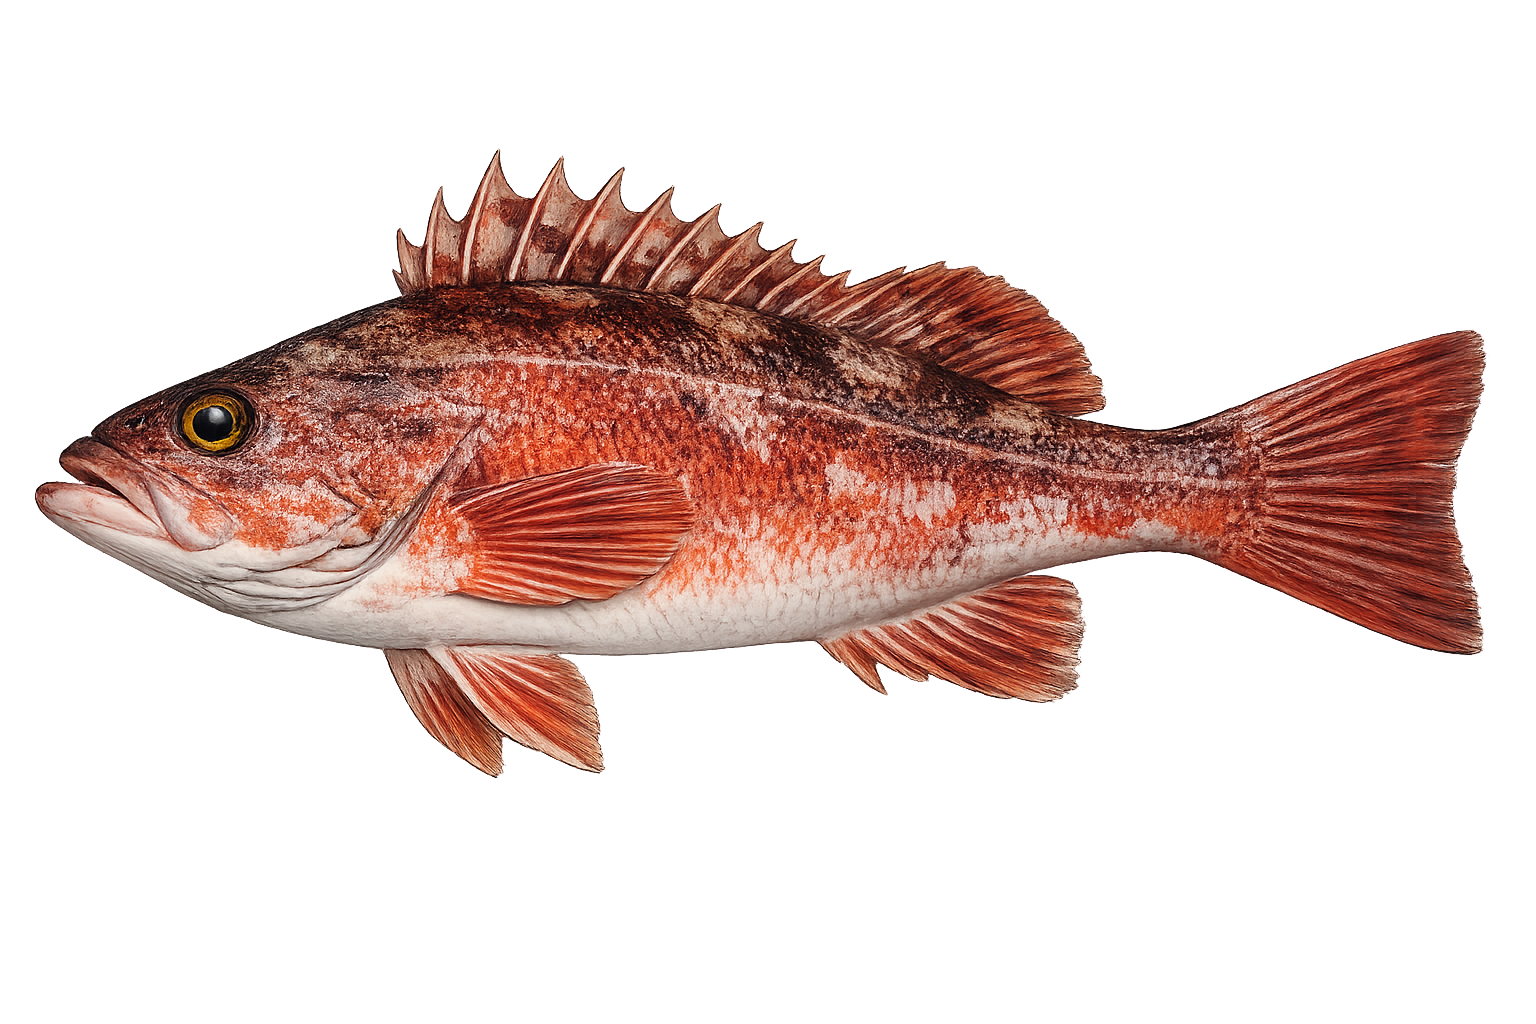
Vermilion Rockfish (Reds): fish landed by month, 2025 versus 2026 so far. 2025 peak April, 5,643 fish.
- 2025
- 20,863 fish
- 2026 so far
- 17,859 fish
Peak: Apr (28.5%) · Core months: Apr–Nov · Sample: 75,490 fish landed over 3 years
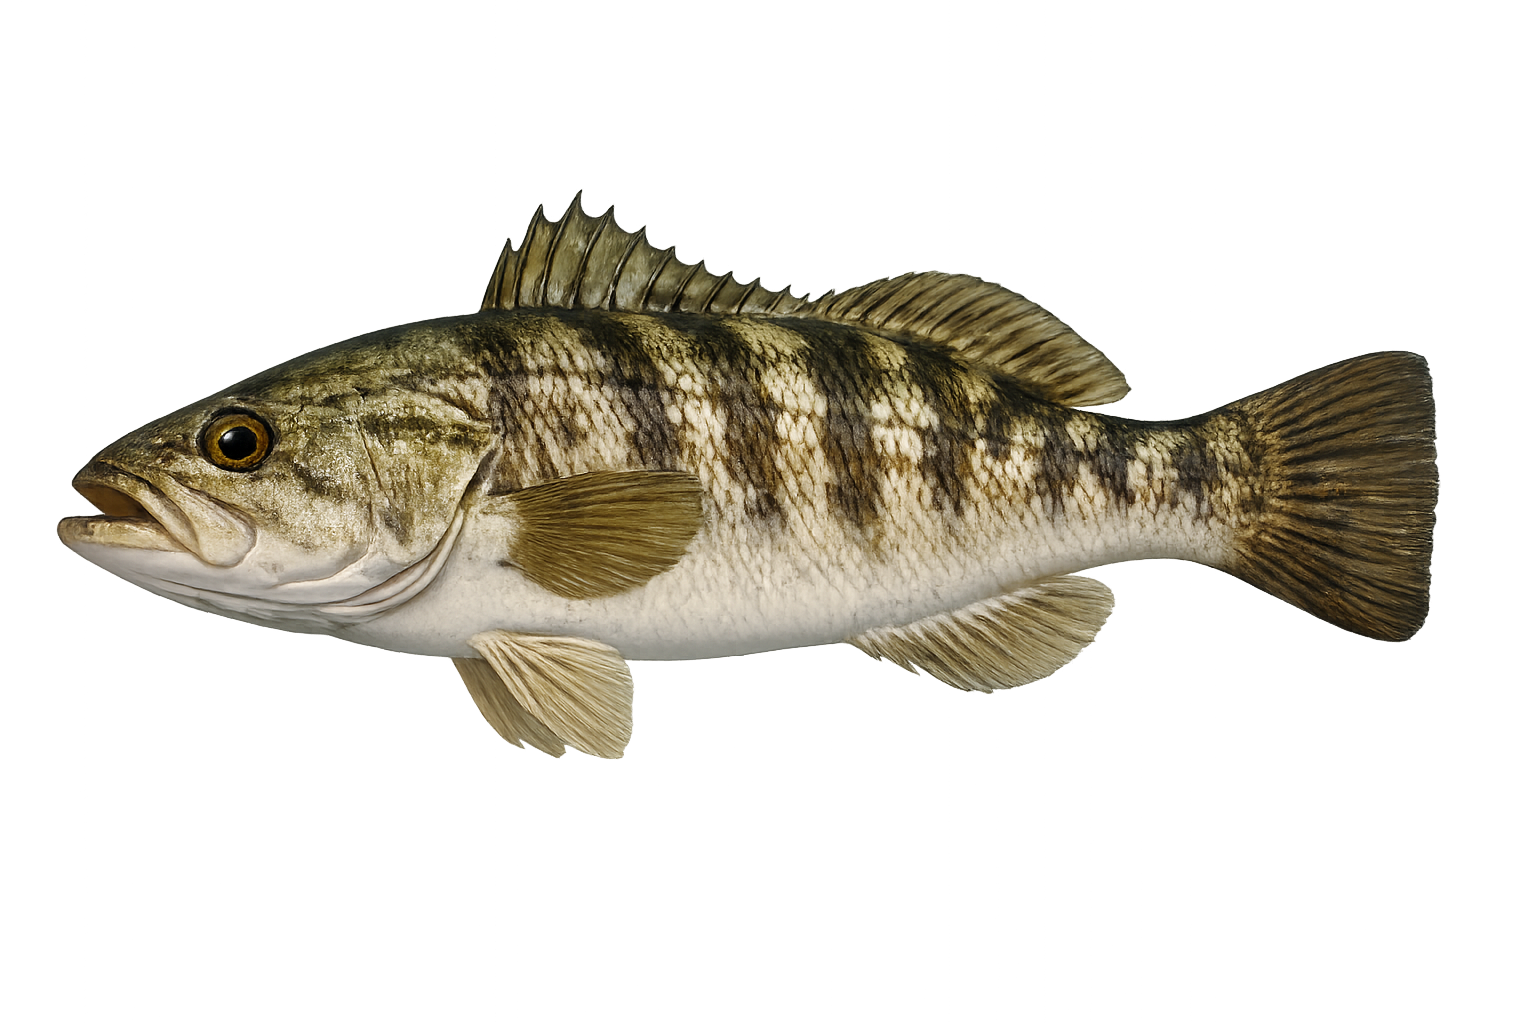
Sand Bass (Barred Sand Bass): fish landed by month, 2025 versus 2026 so far. 2025 peak July, 28,189 fish.
- 2025
- 72,908 fish
- 2026 so far
- 42,847 fish
Peak: Jul (31.6%) · Core months: Jun–Sep · Sample: 151,573 fish landed over 3 years
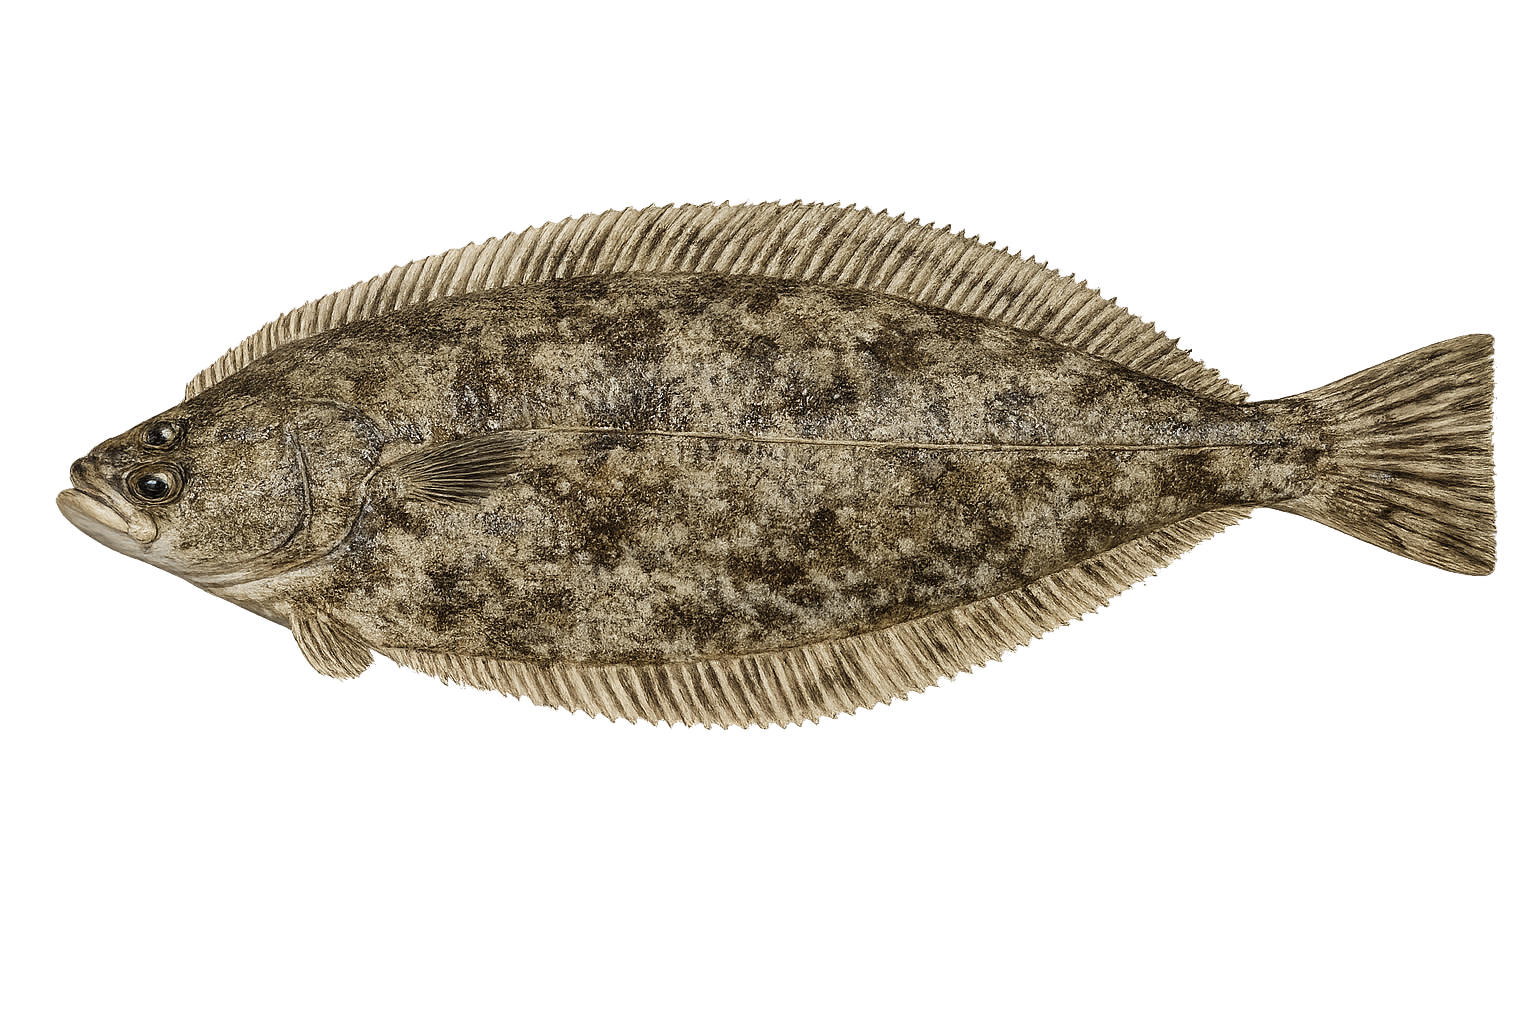
Rock Sole: fish landed by month, 2025 versus 2026 so far. 2025 peak July, 53 fish.
- 2025
- 299 fish
- 2026 so far
- 135 fish
Peak: Jun (18.3%) · Core months: Apr–Oct · Sample: 1,423 fish landed over 3 years
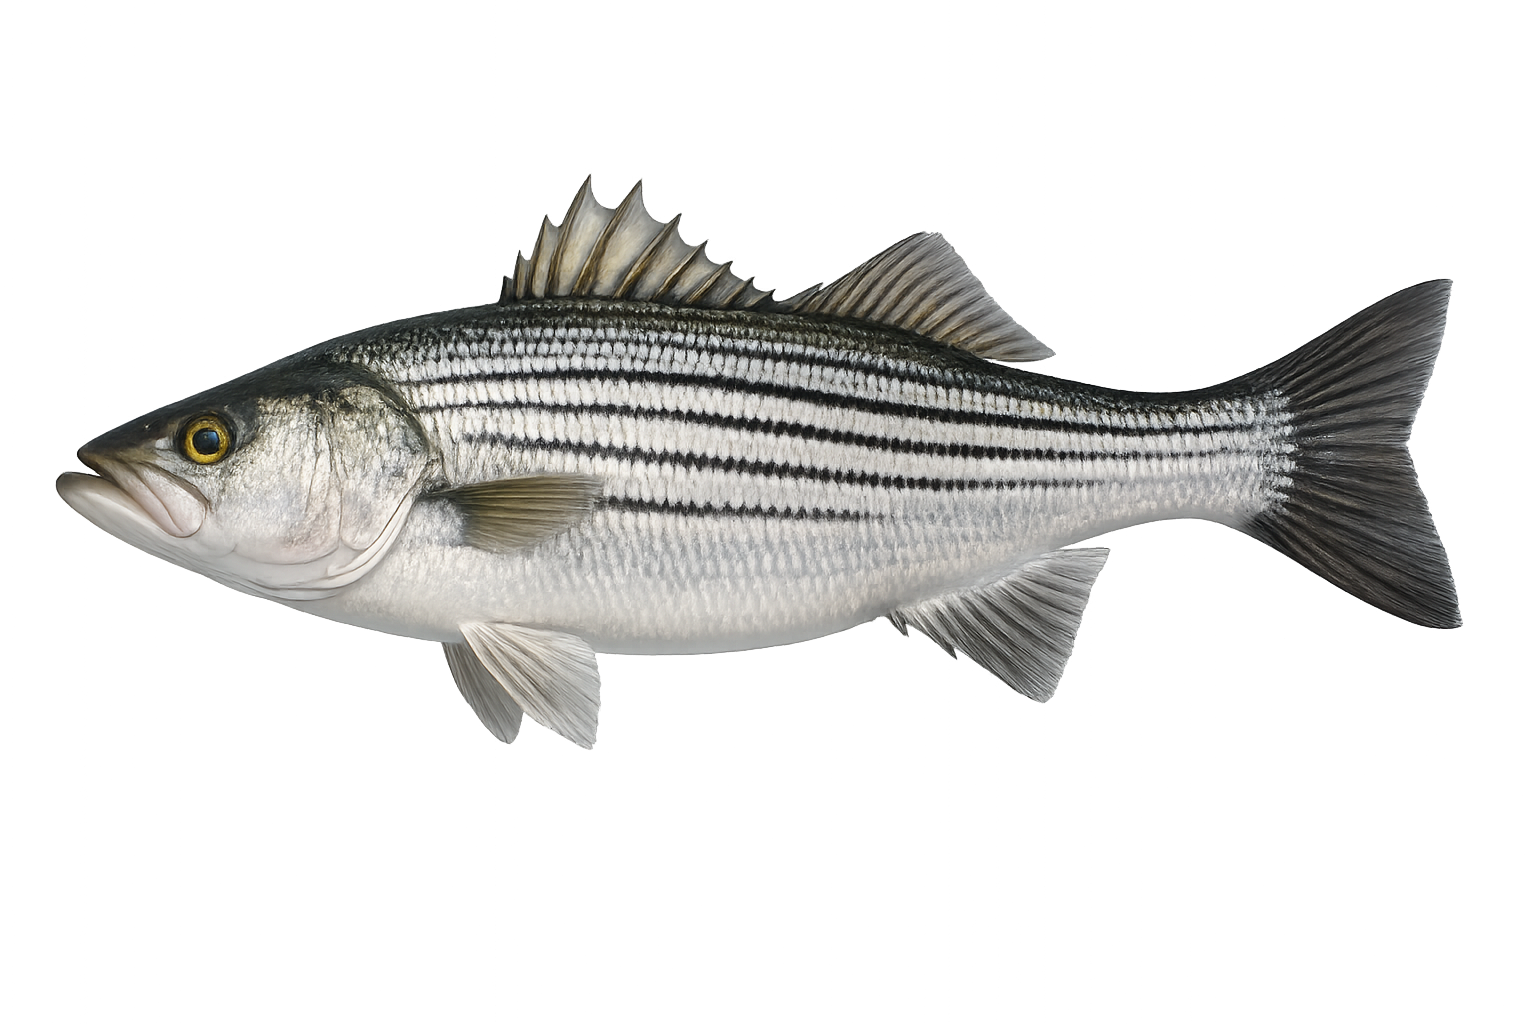
Striped Bass: fish landed by month, 2025 versus 2026 so far. 2025 peak June, 4,598 fish.
- 2025
- 16,408 fish
- 2026 so far
- 10,482 fish
Peak: Jun (33%) · Core months: Apr–Oct · Sample: 43,043 fish landed over 3 years
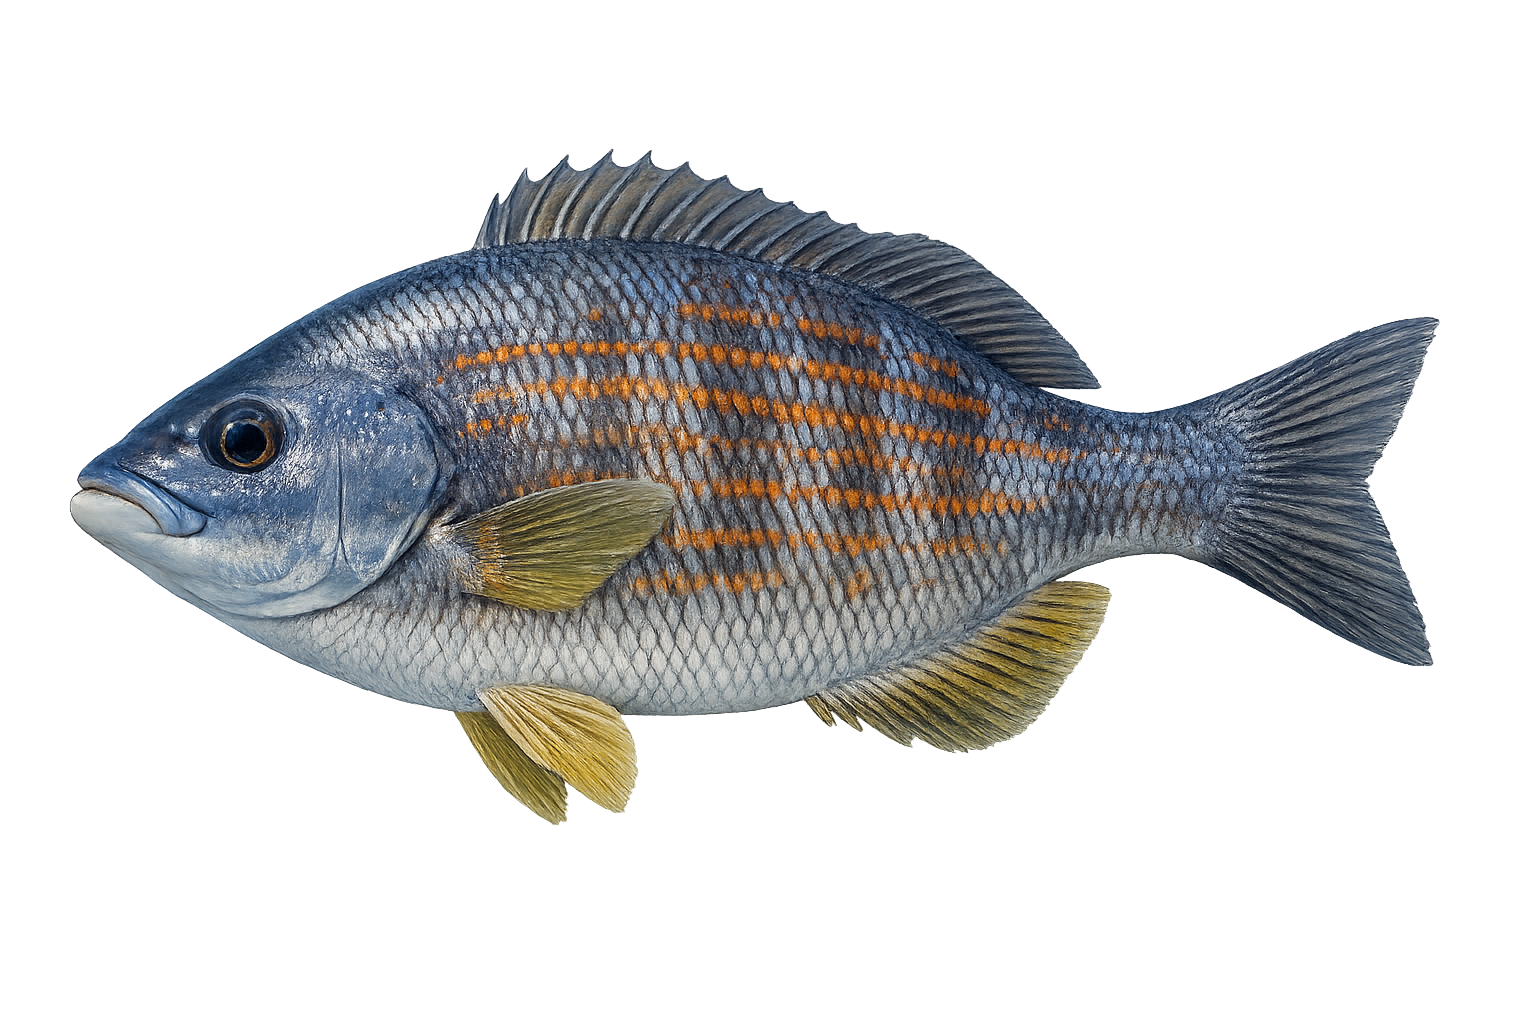
Blue Perch (Striped Seaperch): fish landed by month, 2025 versus 2026 so far. 2025 peak July, 4,039 fish.
- 2025
- 13,035 fish
- 2026 so far
- 22,957 fish
Peak: Jul (23.3%) · Core months: Jun–Dec · Sample: 20,914 fish landed over 3 years

Brown Rock Crab: fish landed by month, 2025 versus 2026 so far. 2025 peak October, 405 fish.
- 2025
- 1,008 fish
- 2026 so far
- 148 fish
Peak: Oct (41%) · Core months: Oct–Mar · Sample: 2,954 fish landed over 3 years
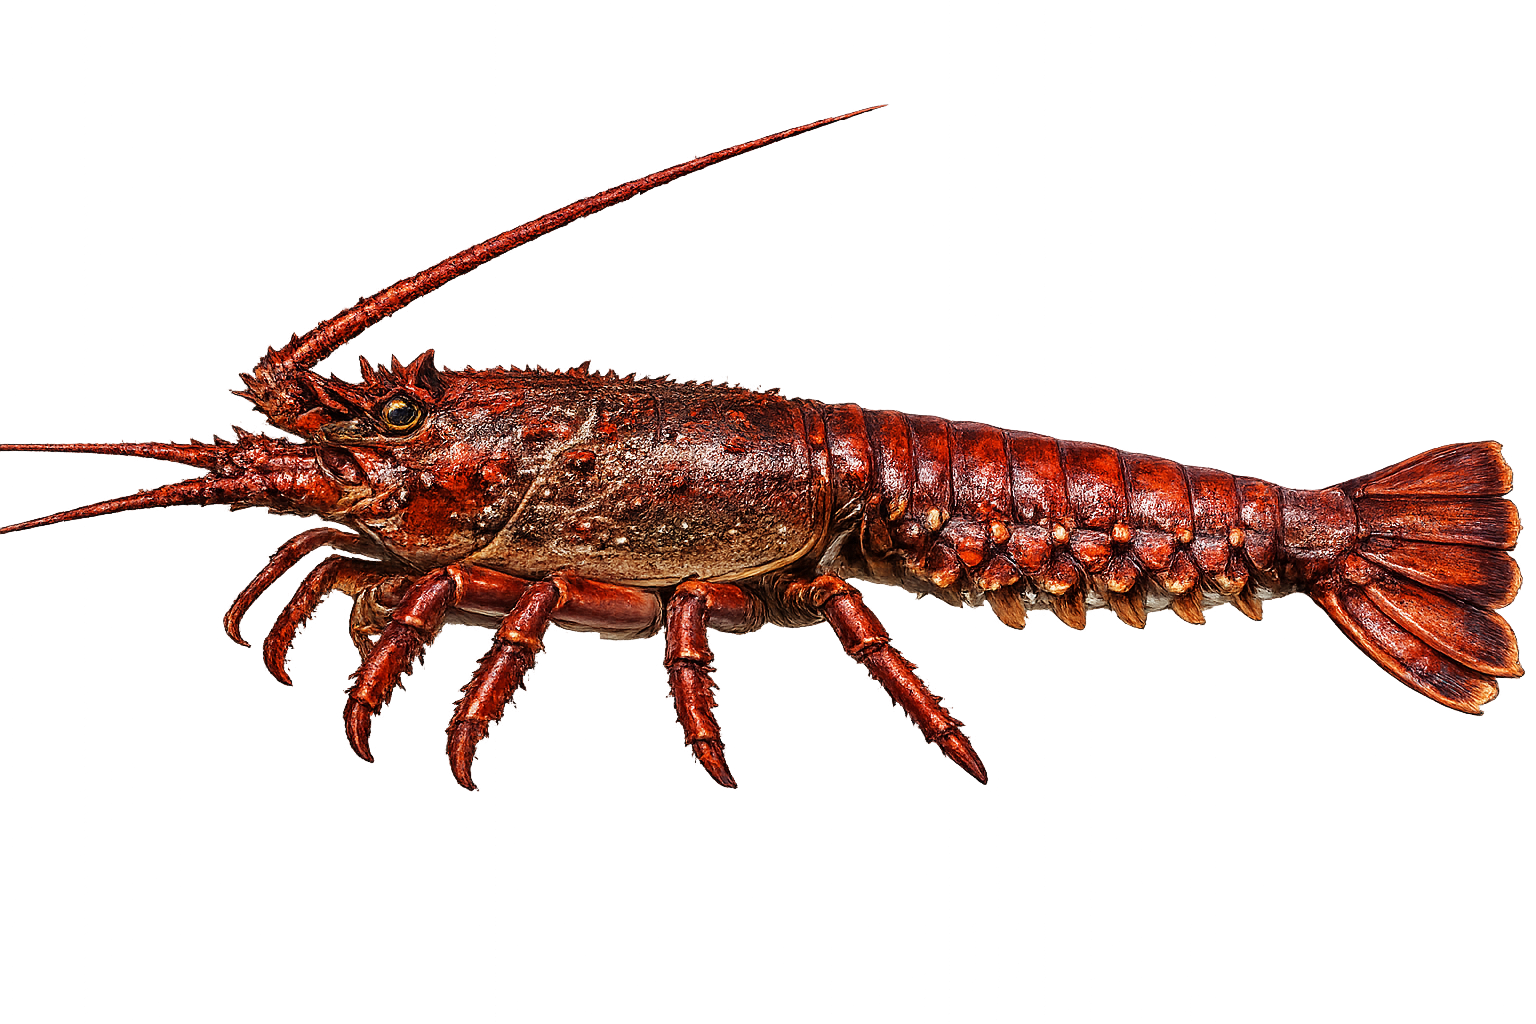
California Spiny Lobster: fish landed by month, 2025 versus 2026 so far. 2025 peak December, 2,084 fish.
- 2025
- 6,485 fish
- 2026 so far
- 2,821 fish
Peak: Oct (30.8%) · Core months: Sep–Mar · Sample: 16,196 fish landed over 3 years
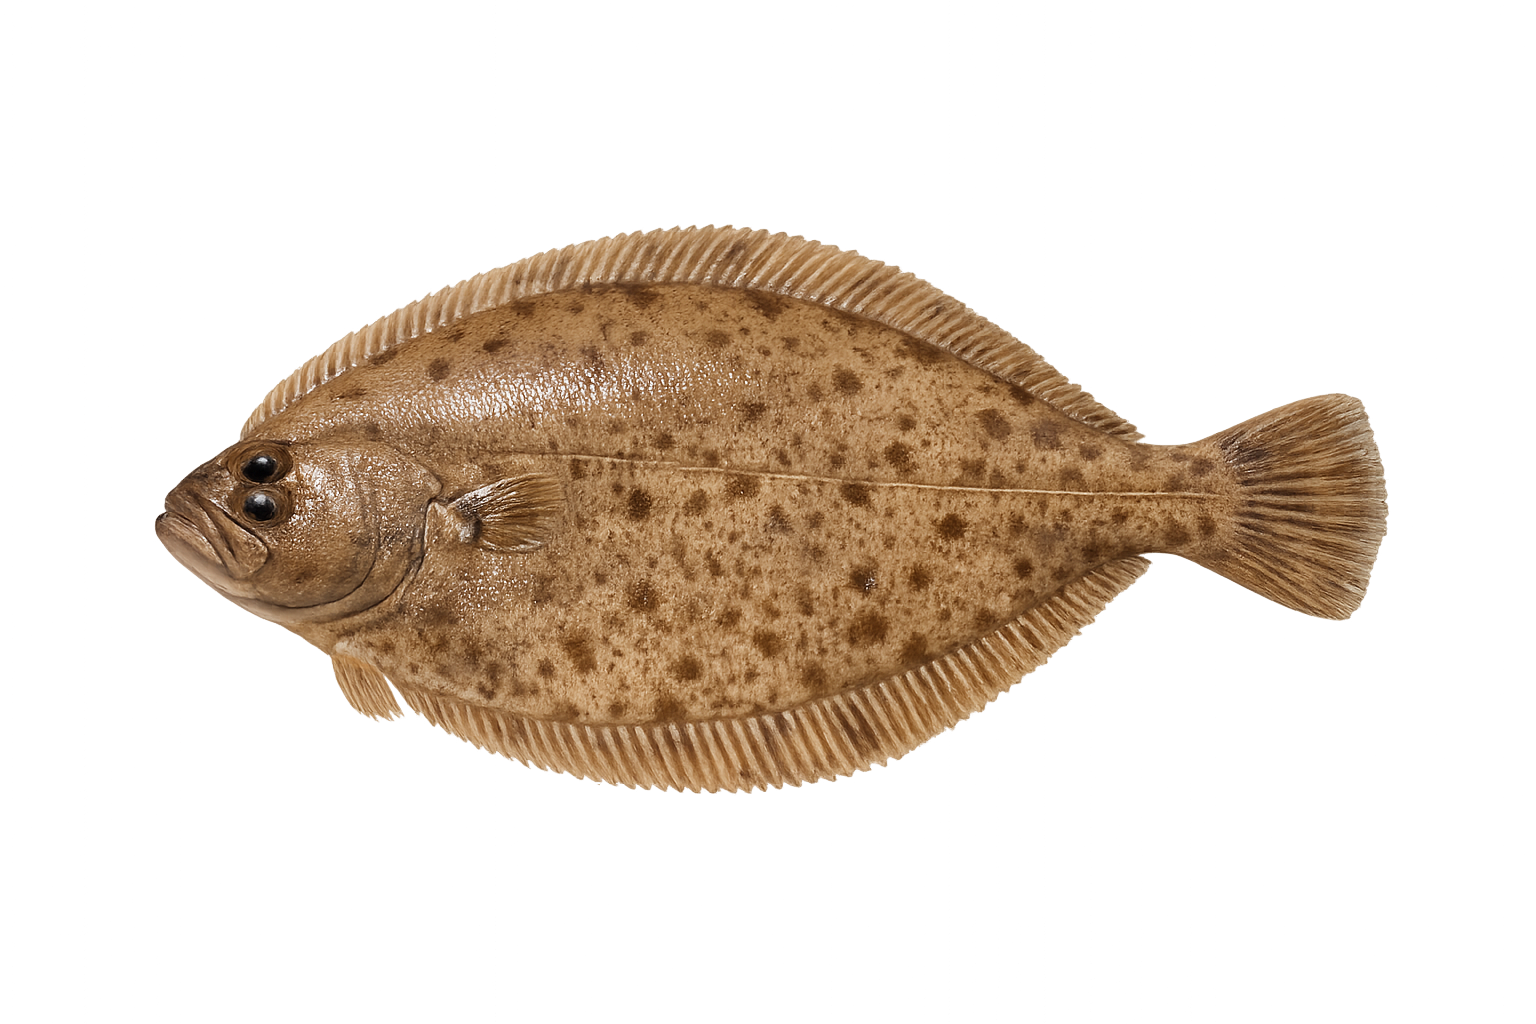
Petrale Sole: fish landed by month, 2025 versus 2026 so far. 2025 peak January, 155 fish.
- 2025
- 451 fish
- 2026 so far
- 312 fish
Peak: Jun (18.2%) · Core months: Jan–Sep · Sample: 2,664 fish landed over 3 years
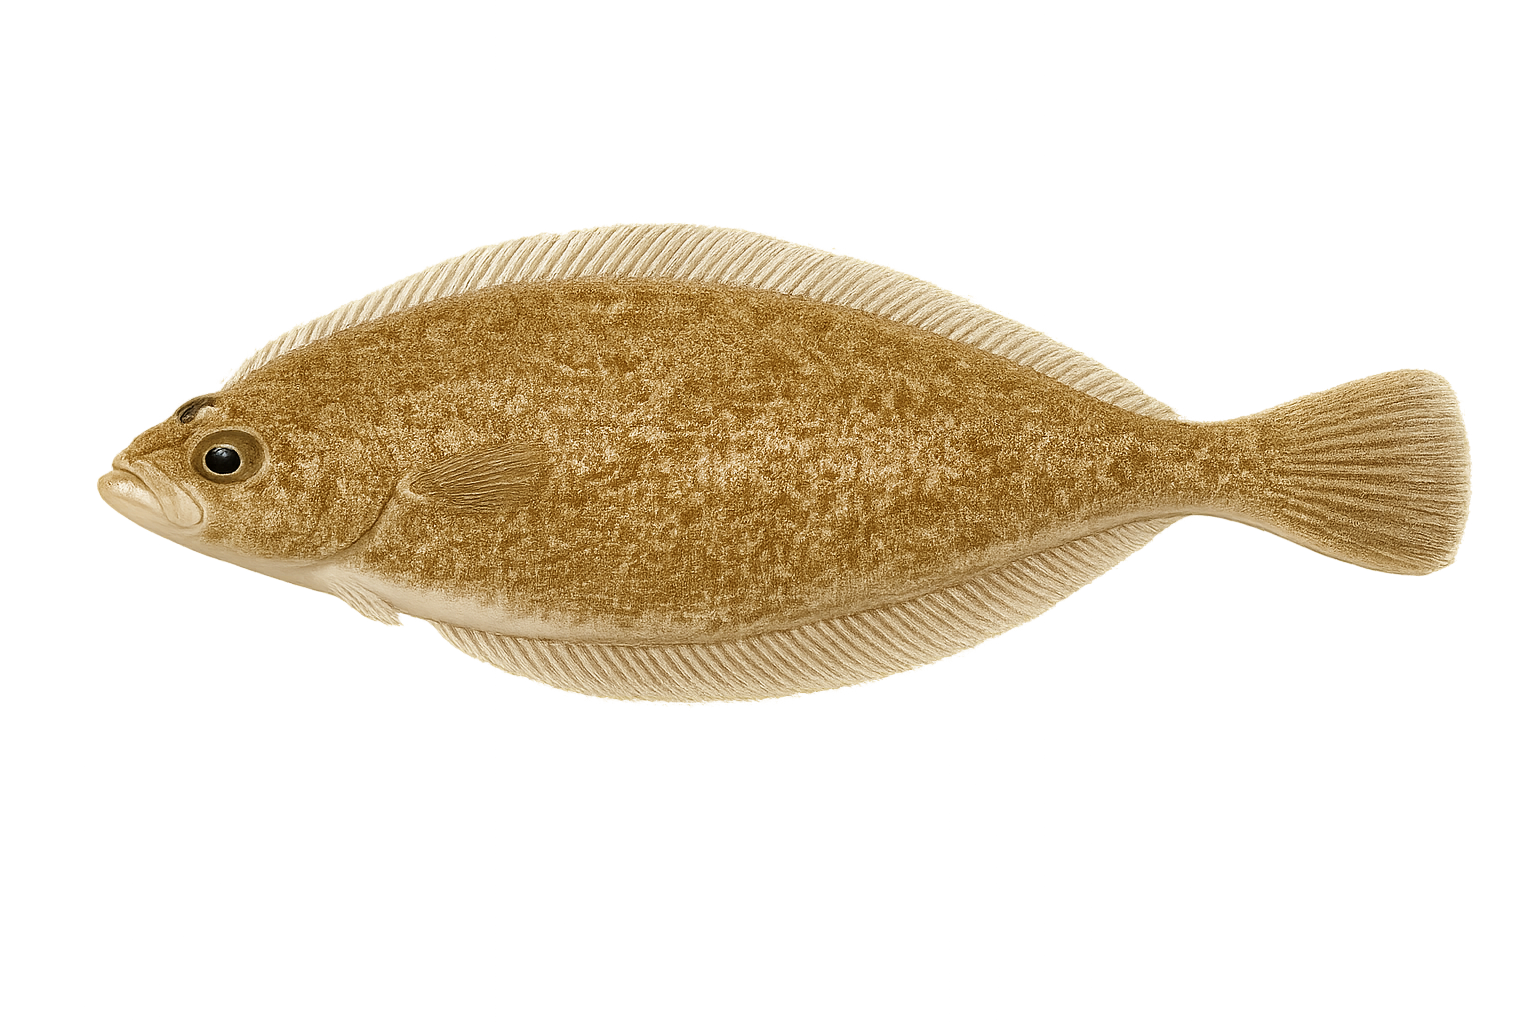
Pacific Sanddab: fish landed by month, 2025 versus 2026 so far. 2025 peak February, 30,044 fish.
- 2025
- 99,940 fish
- 2026 so far
- 107,773 fish
Peak: Jan (30.5%) · Core months: Dec–Mar · Sample: 273,678 fish landed over 3 years
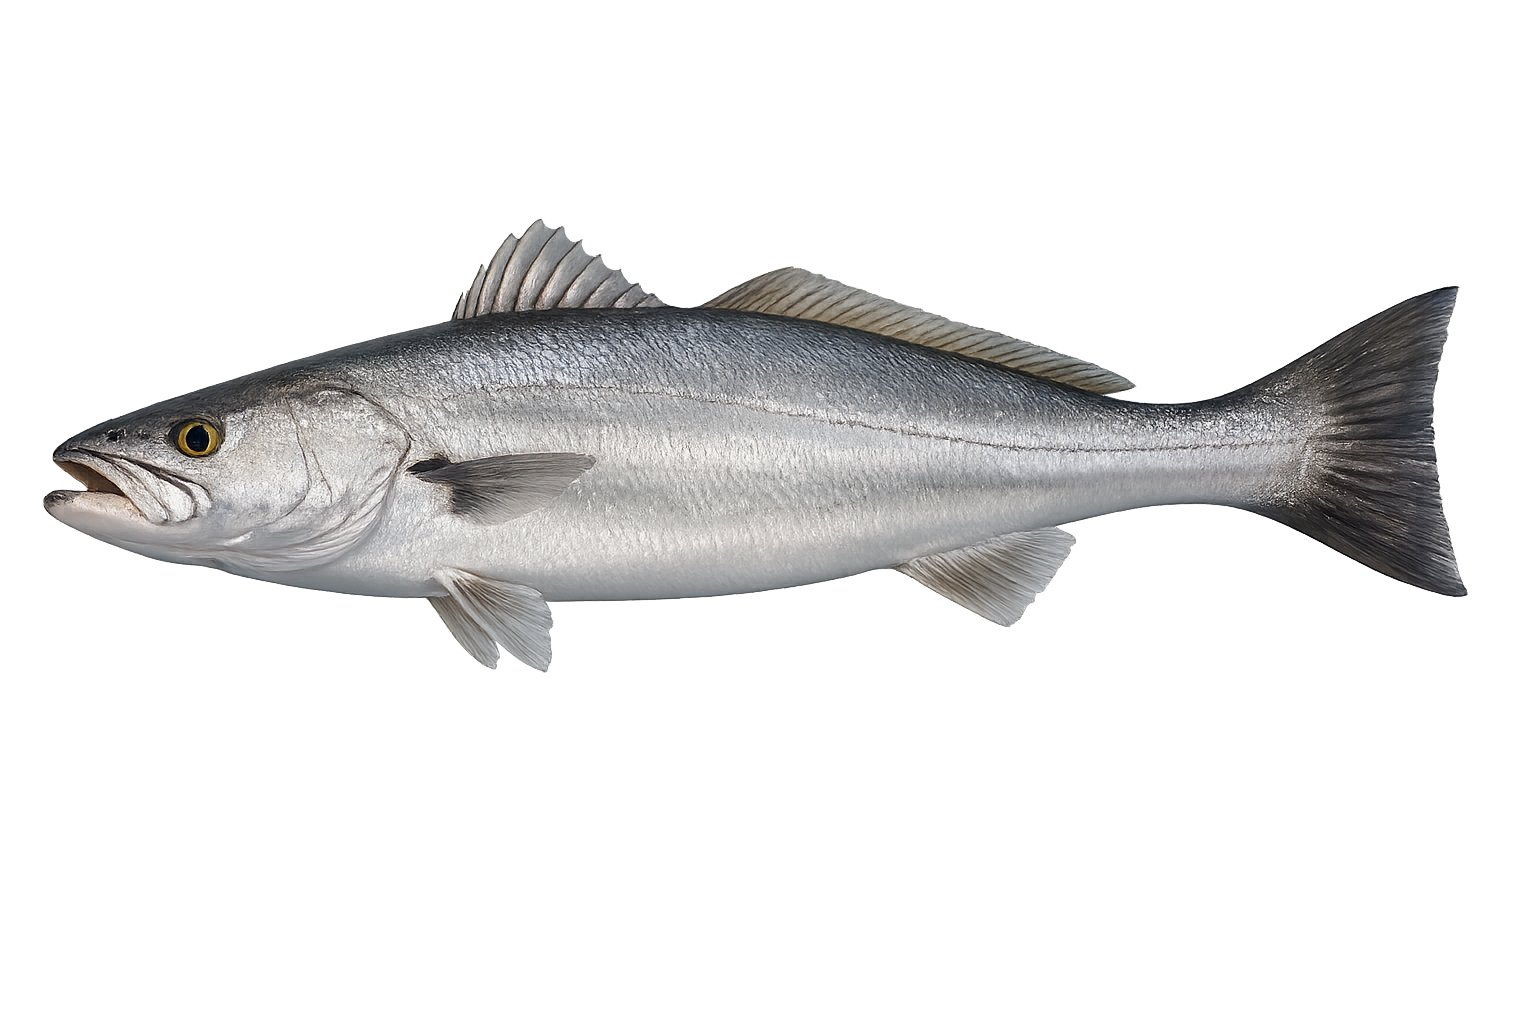
White Seabass: fish landed by month, 2025 versus 2026 so far. 2025 peak June, 2,391 fish.
- 2025
- 7,917 fish
- 2026 so far
- 3,191 fish
Peak: Jun (27.3%) · Core months: Apr–Sep · Sample: 13,179 fish landed over 3 years
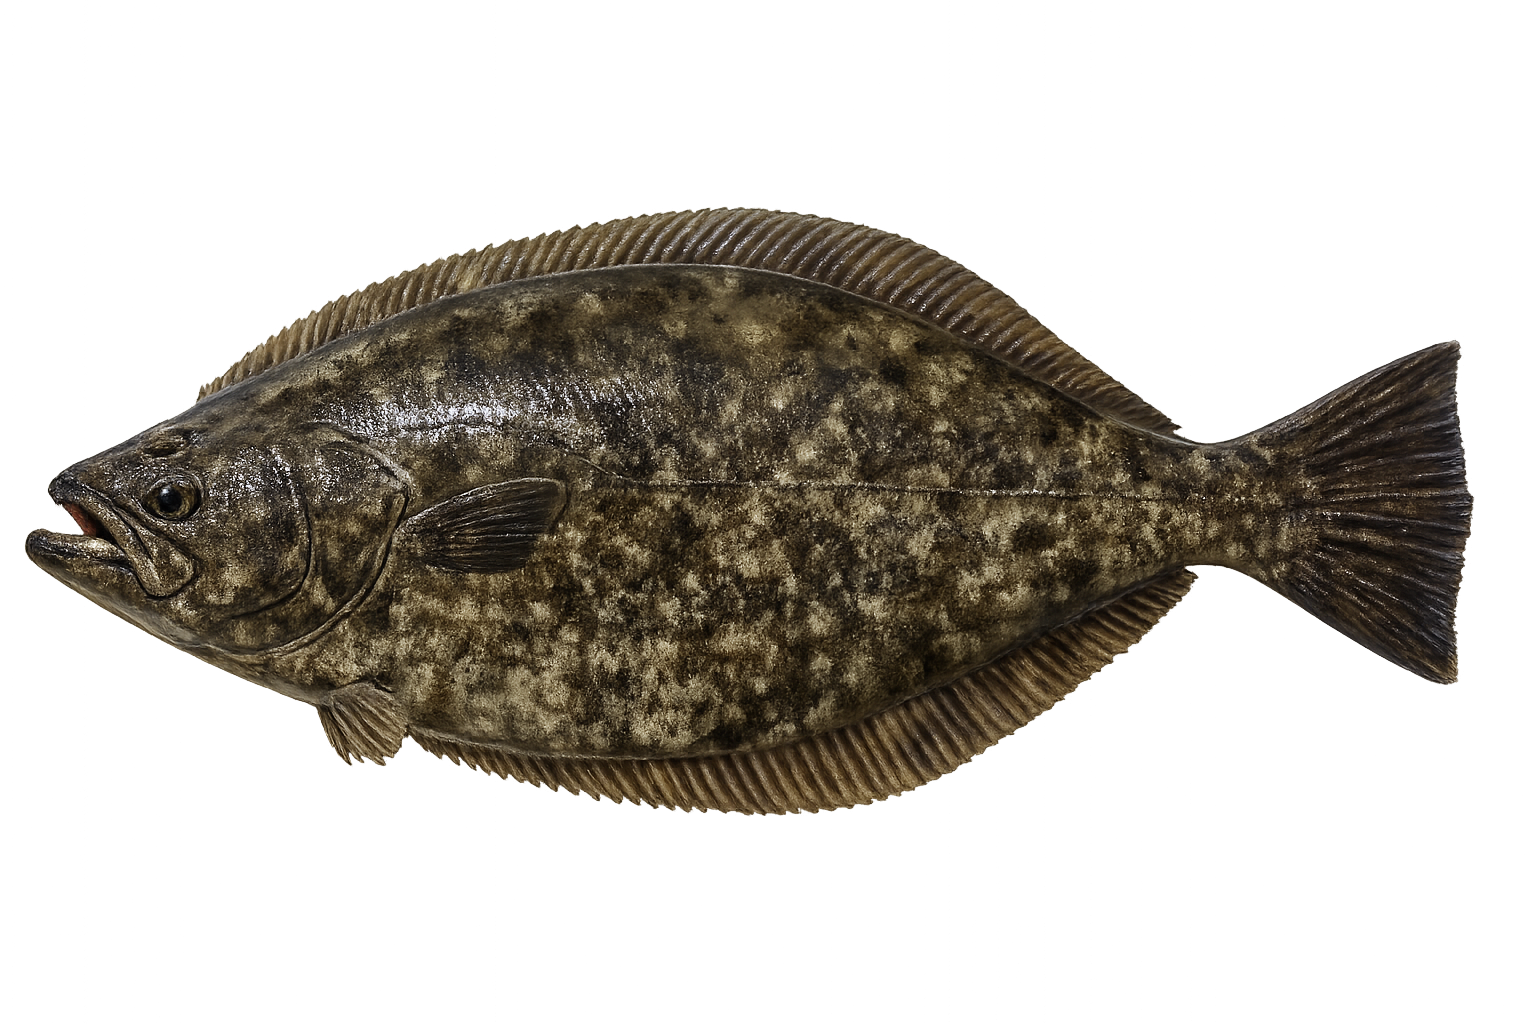
California Halibut: fish landed by month, 2025 versus 2026 so far. 2025 peak June, 4,910 fish.
- 2025
- 16,015 fish
- 2026 so far
- 5,214 fish
Peak: May (25.8%) · Core months: Apr–Aug · Sample: 68,242 fish landed over 3 years
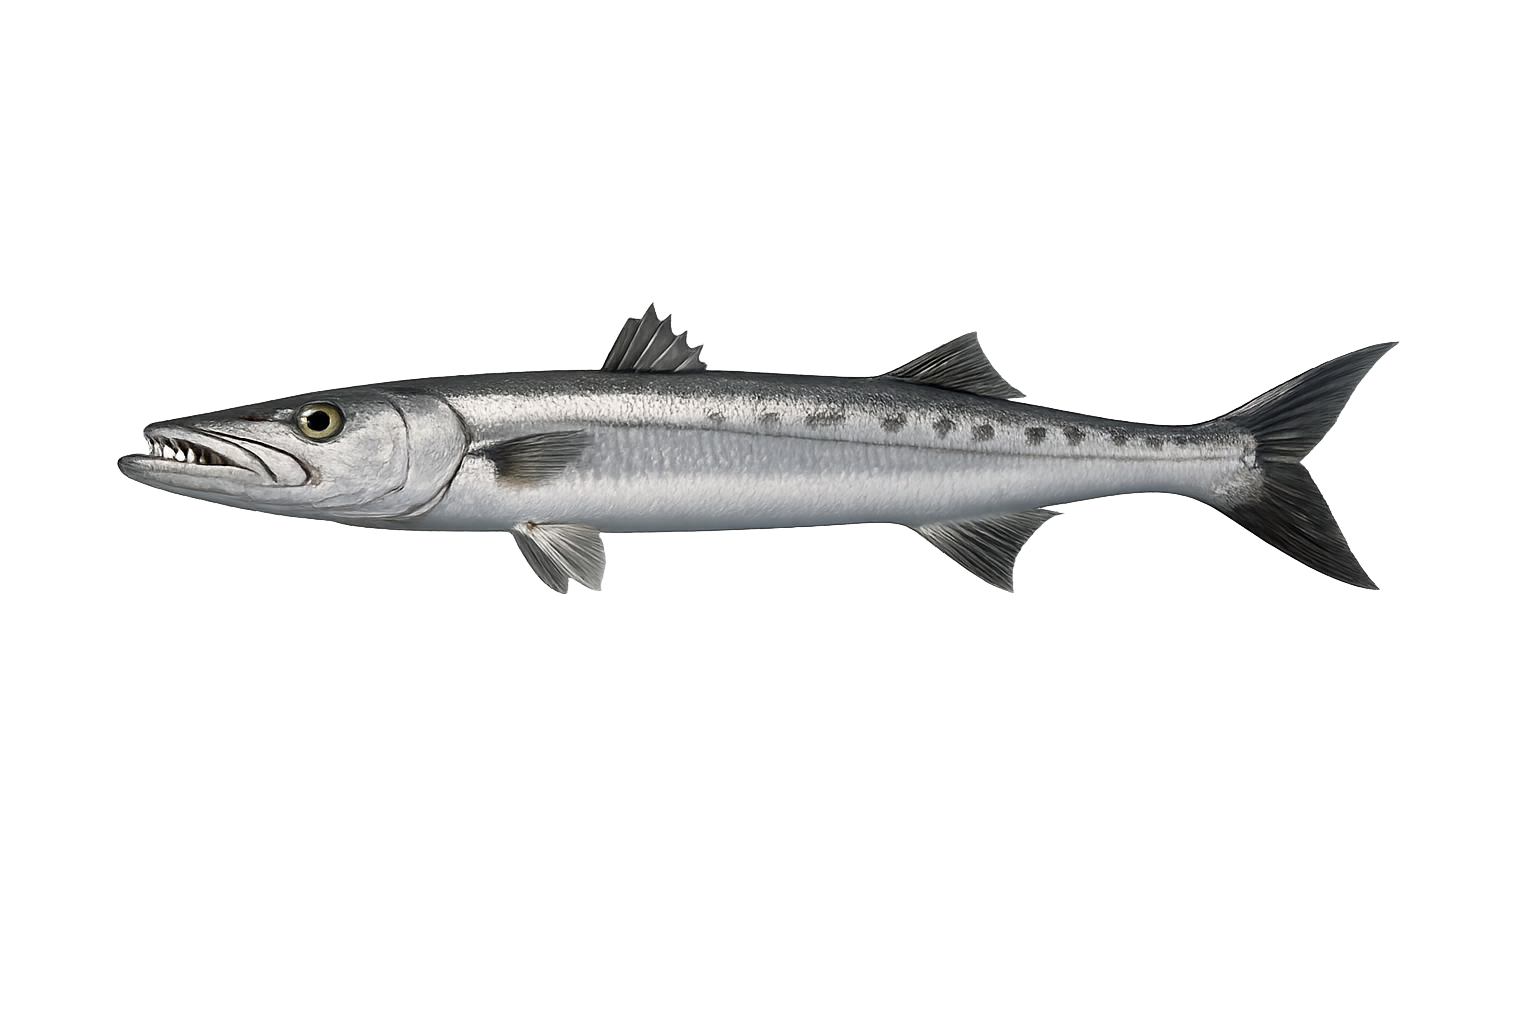
California Barracuda: fish landed by month, 2025 versus 2026 so far. 2025 peak July, 4,620 fish.
- 2025
- 13,762 fish
- 2026 so far
- 36,049 fish
Peak: Jul (51.7%) · Core months: Jun–Aug · Sample: 47,719 fish landed over 3 years
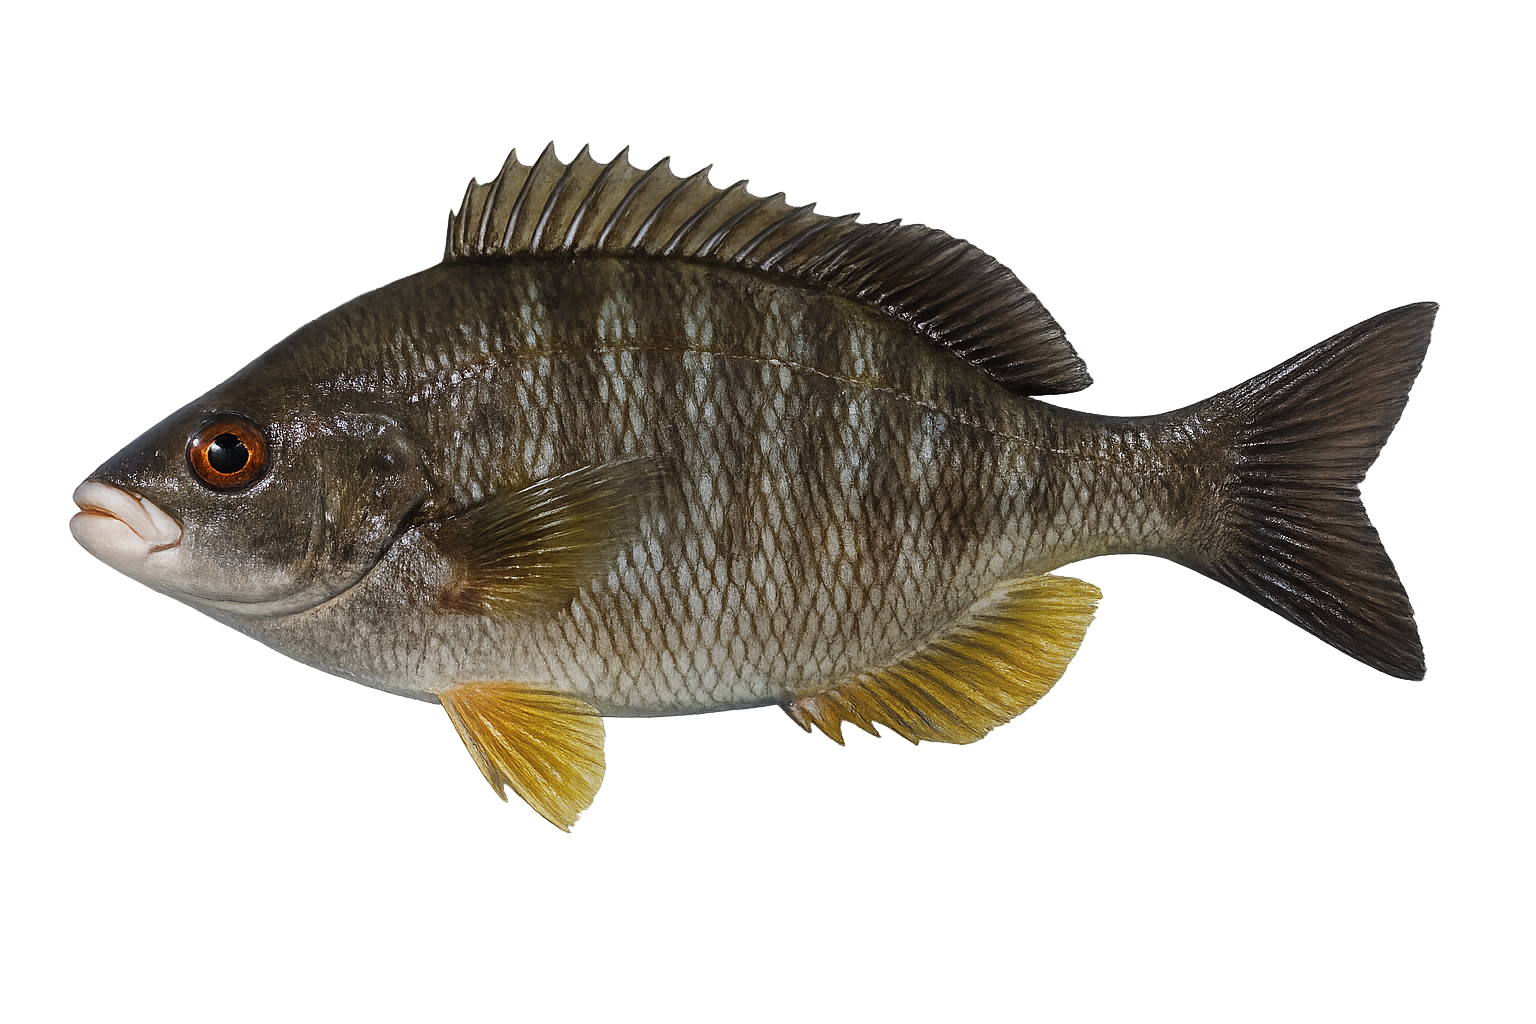
Blacksmith Perch (Black Perch): fish landed by month, 2025 versus 2026 so far. 2025 peak January, 101 fish.
- 2025
- 307 fish
- 2026 so far
- 133 fish
Peak: Jan (35.4%) · Core months: Nov–Mar · Sample: 4,005 fish landed over 3 years
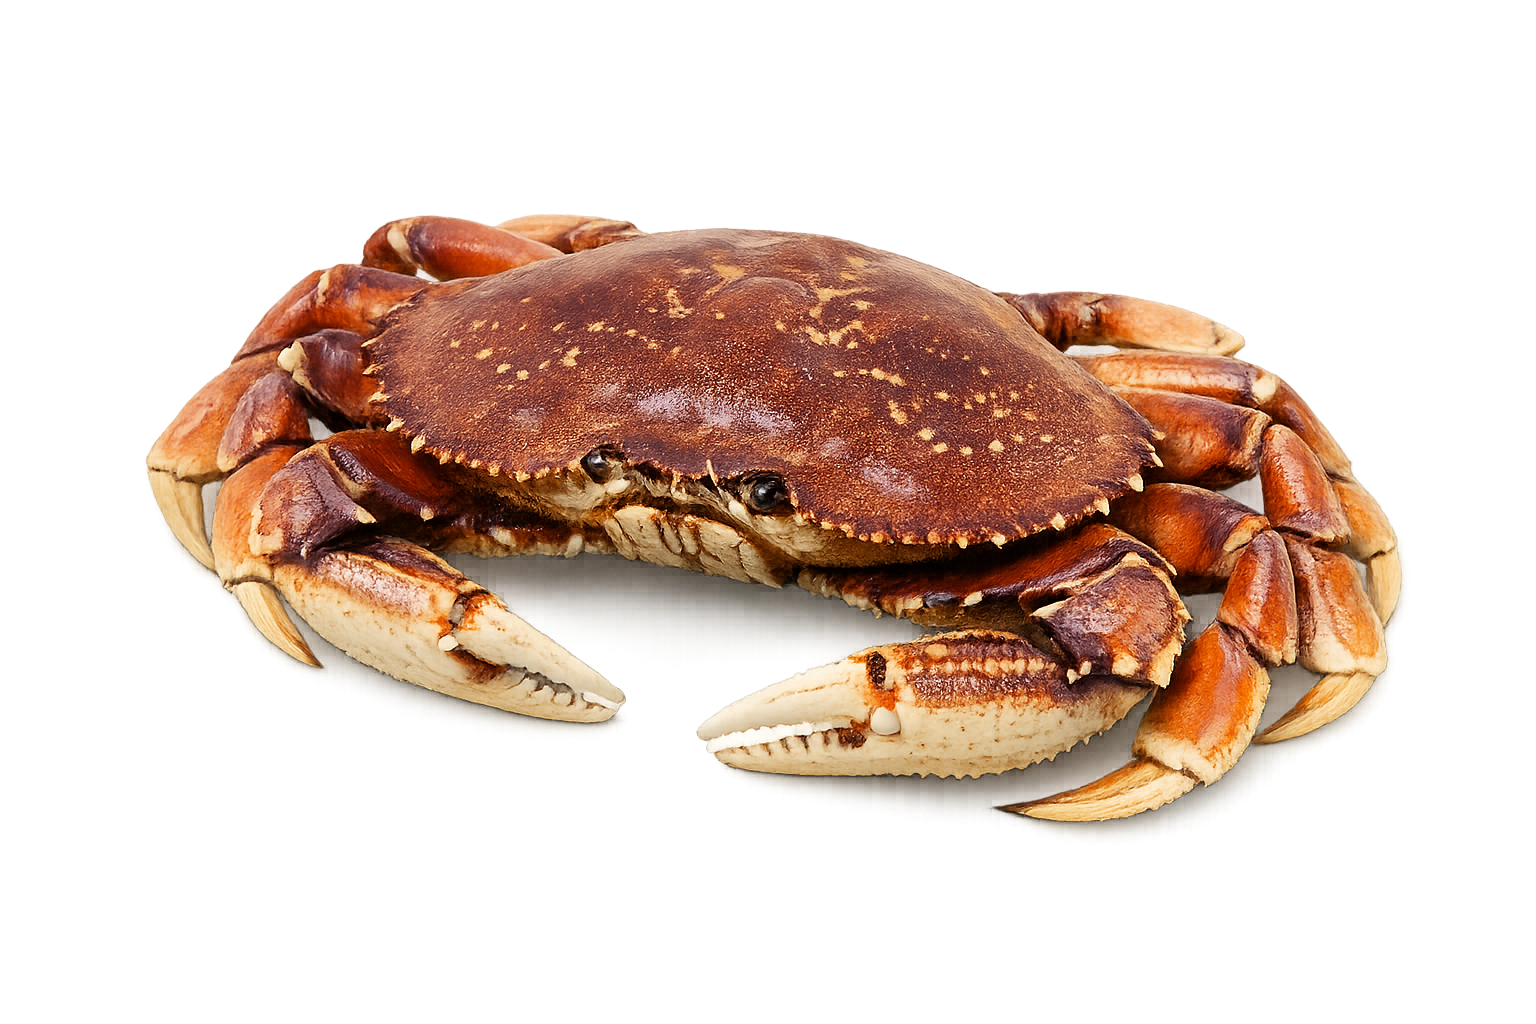
Dungeness Crab: fish landed by month, 2025 versus 2026 so far. 2025 peak November, 50,070 fish.
- 2025
- 81,631 fish
- 2026 so far
- 2,610 fish
Peak: Nov (60.7%) · Core months: Nov–Dec · Sample: 224,180 fish landed over 3 years
Source: California charter dock reports, 2023–2025. Species with too few reported trips to show a reliable pattern are omitted here rather than guessed at.