

Oxnard Fishing Seasonality
When Oxnard charter boats actually landed each species, derived from 2023–2025 California charter dock reports — not a promised or predicted season. This is a record of what boats caught, never a guarantee of what’s legal to keep; always check current CDFW regulations before you fish.
Updated
What's landing right now
Fish reported in the last 7 days through October 10, 2026
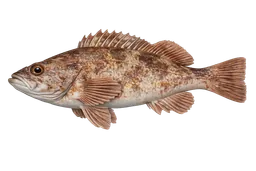
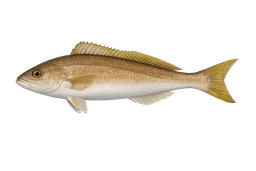
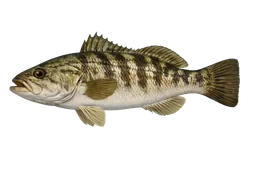
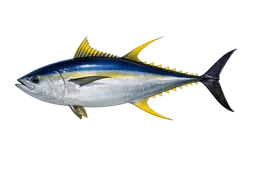
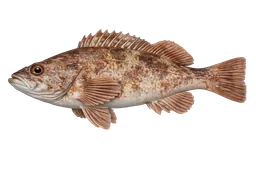
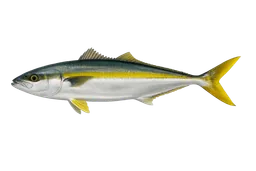
Species by Oct catch share
Each chart is fish landed per month by Oxnard charter boats: 2025 in full as the shaded line, 2026 to date as the bold line. The bars underneath are the 2023–2025 share of annual catch.
- 2025 full season
- 2026 through Sep (totals counted through Oct 10)
- Hover or tap a month for the numbers.
Peak: Oct (45.1%) · Core months: Sep–Oct · Sample: 731 fish landed over 3 years
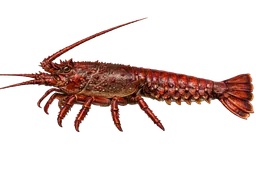
Peak: Sep (34.4%) · Core months: Sep–Nov · Sample: 326 fish landed over 3 years
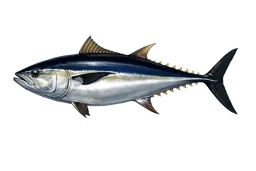
Peak: Sep (32.3%) · Core months: Jul–Oct · Sample: 5,612 fish landed over 3 years
Peak: Aug (41.2%) · Core months: Jun–Oct · Sample: 873 fish landed over 3 years
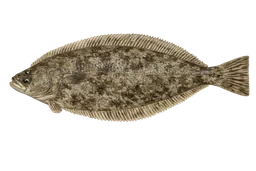
Peak: Aug (22.1%) · Core months: Apr–Oct · Sample: 802 fish landed over 3 years
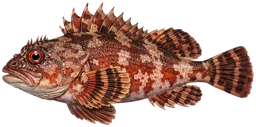
Peak: Jun (15.8%) · Core months: Apr–Oct · Sample: 5,619 fish landed over 3 years
Peak: Jun (16%) · Core months: Apr–Dec · Sample: 436,556 fish landed over 3 years
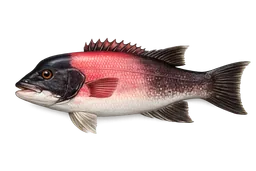
Peak: Jul (19%) · Core months: Apr–Dec · Sample: 13,209 fish landed over 3 years
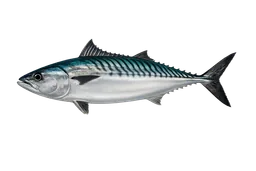
Peak: Sep (42.4%) · Core months: Sep–Nov · Sample: 2,429 fish landed over 3 years
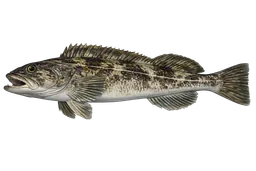
Peak: May (17.2%) · Core months: Apr–Dec · Sample: 9,975 fish landed over 3 years
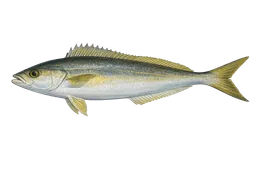
Peak: Aug (17.1%) · Core months: Apr–Oct · Sample: 191,118 fish landed over 3 years
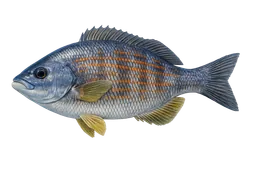
Peak: Dec (28.6%) · Core months: Nov–Jan · Sample: 1,754 fish landed over 3 years
Peak: Jul (32.1%) · Core months: Jun–Sep · Sample: 30,801 fish landed over 3 years
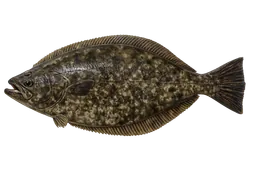
Peak: Jun (30.5%) · Core months: Apr–Aug · Sample: 6,815 fish landed over 3 years
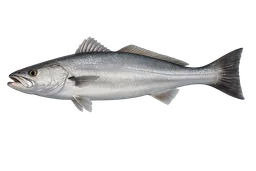
Peak: Jun (34.1%) · Core months: May–Aug · Sample: 6,085 fish landed over 3 years
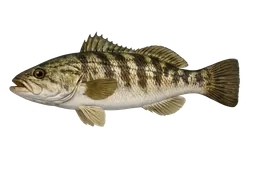
Peak: Aug (32%) · Core months: Jun–Aug · Sample: 11,096 fish landed over 3 years
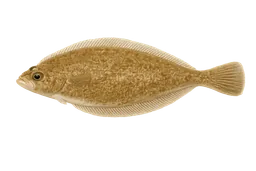
Peak: Jan (50.7%) · Core months: Dec–Mar · Sample: 79,056 fish landed over 3 years
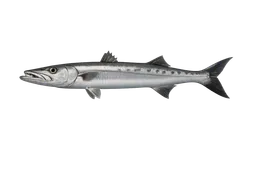
Peak: Jul (59.4%) · Core months: Jun–Aug · Sample: 18,005 fish landed over 3 years
Source: California charter dock reports, 2023–2025. Species with too few reported trips to show a reliable pattern are omitted here rather than guessed at.