
San Diego Fishing Seasonality
When San Diego charter boats actually landed each species, derived from 2023–2025 California charter dock reports — not a promised or predicted season. This is a record of what boats caught, never a guarantee of what's legal to keep; always check current CDFW regulations before you fish.
Updated
What's landing right now
Species by Sep catch share
Each chart is fish landed per month by San Diego charter boats: 2025 in full as the shaded line, 2026 to date as the bold line. The bars underneath are the 2023–2025 share of annual catch.
- 2025 full season
- 2026 through Aug(totals counted through Sep 22)
- Hover or tap a month for the numbers.
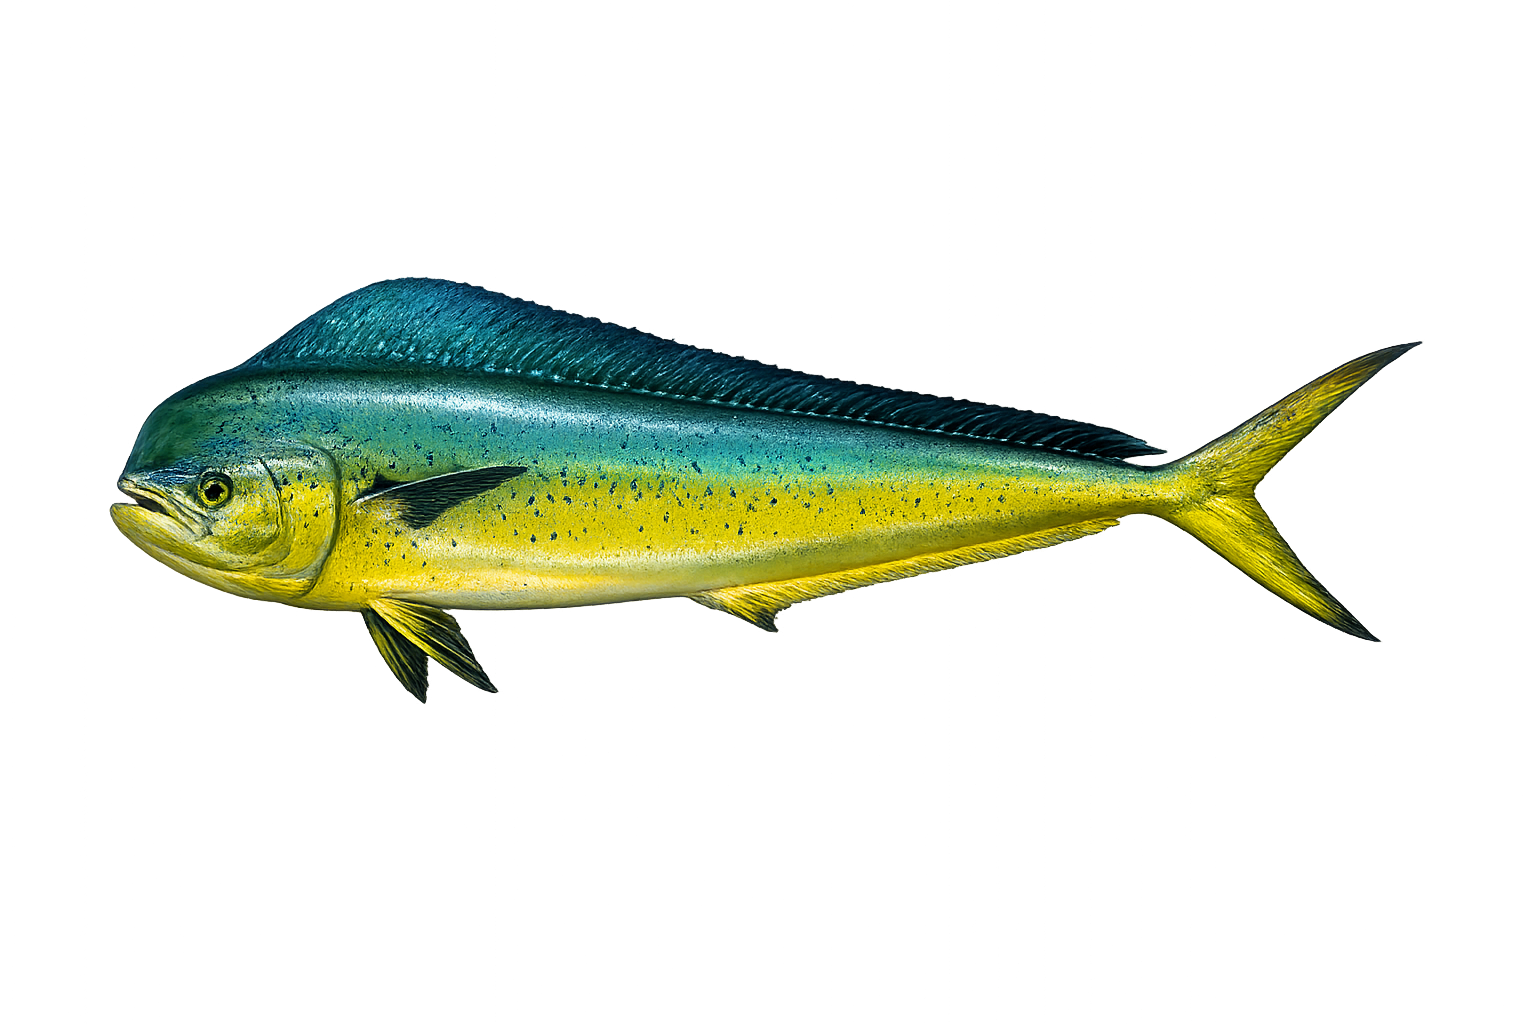
Dorado (Mahi-Mahi): fish landed by month, 2025 versus 2026 so far. 2025 peak October, 132 fish.
- 2025
- 266 fish
- 2026 so far
- 9,090 fish
Peak: Sep (50.9%) · Core months: Aug–Oct · Sample: 27,082 fish landed over 3 years
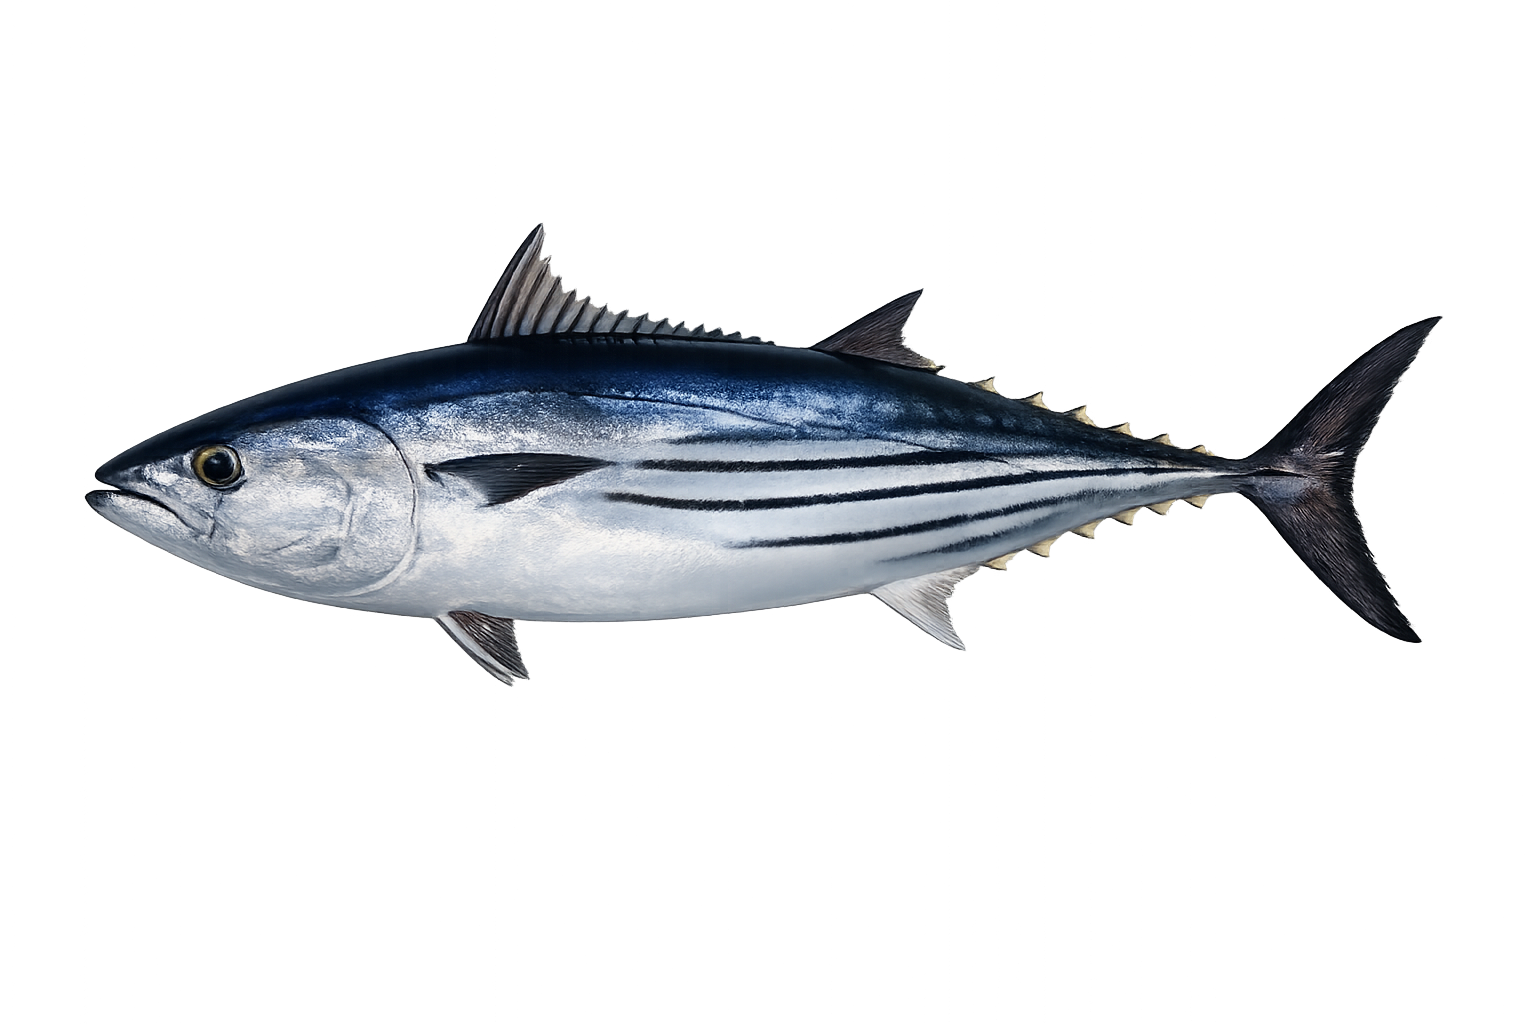
Skipjack Tuna: fish landed by month, 2025 versus 2026 so far. 2025 peak September, 307 fish.
- 2025
- 500 fish
- 2026 so far
- 2,870 fish
Peak: Sep (46.6%) · Core months: Sep–Nov · Sample: 706 fish landed over 3 years
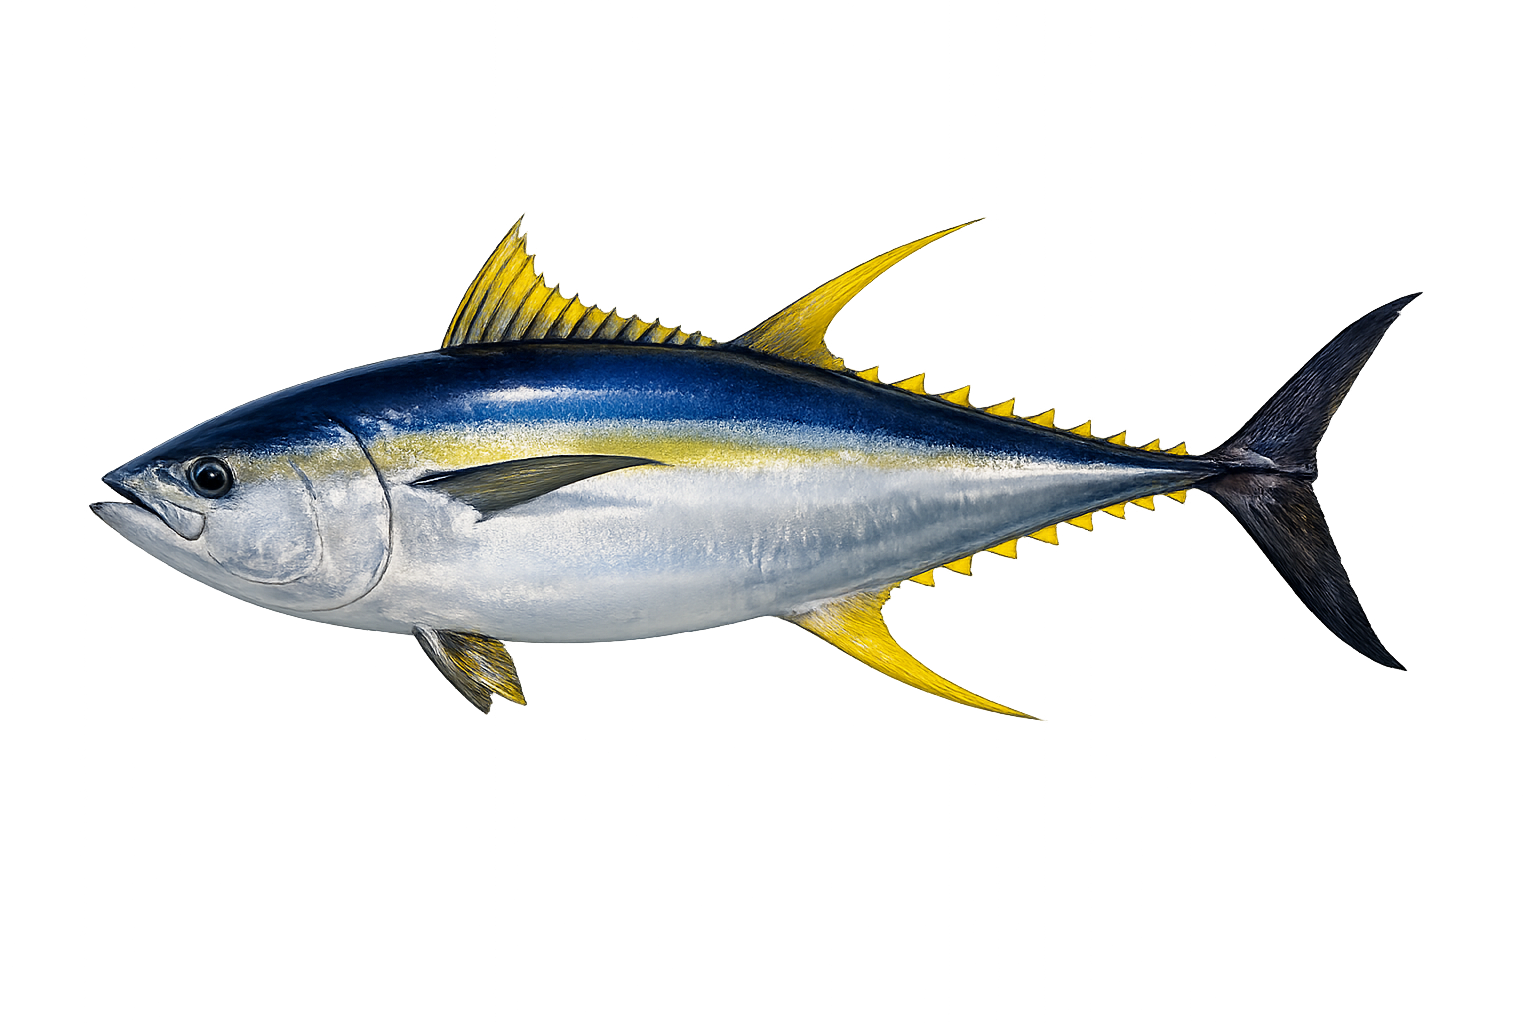
Yellowfin Tuna: fish landed by month, 2025 versus 2026 so far. 2025 peak September, 4,480 fish.
- 2025
- 6,407 fish
- 2026 so far
- 29,652 fish
Peak: Sep (43%) · Core months: Sep–Nov · Sample: 32,829 fish landed over 3 years
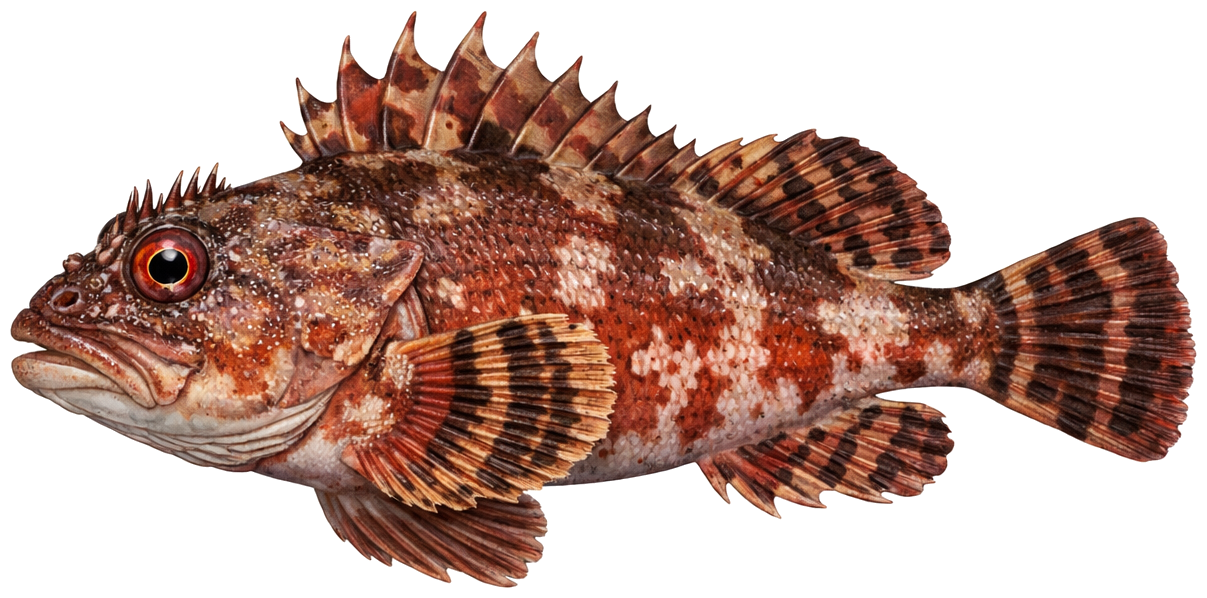
Sculpin (California Scorpionfish): fish landed by month, 2025 versus 2026 so far. 2025 peak September, 2,267 fish.
- 2025
- 10,762 fish
- 2026 so far
- 6,975 fish
Peak: Sep (24.2%) · Core months: Aug–Apr · Sample: 26,474 fish landed over 3 years
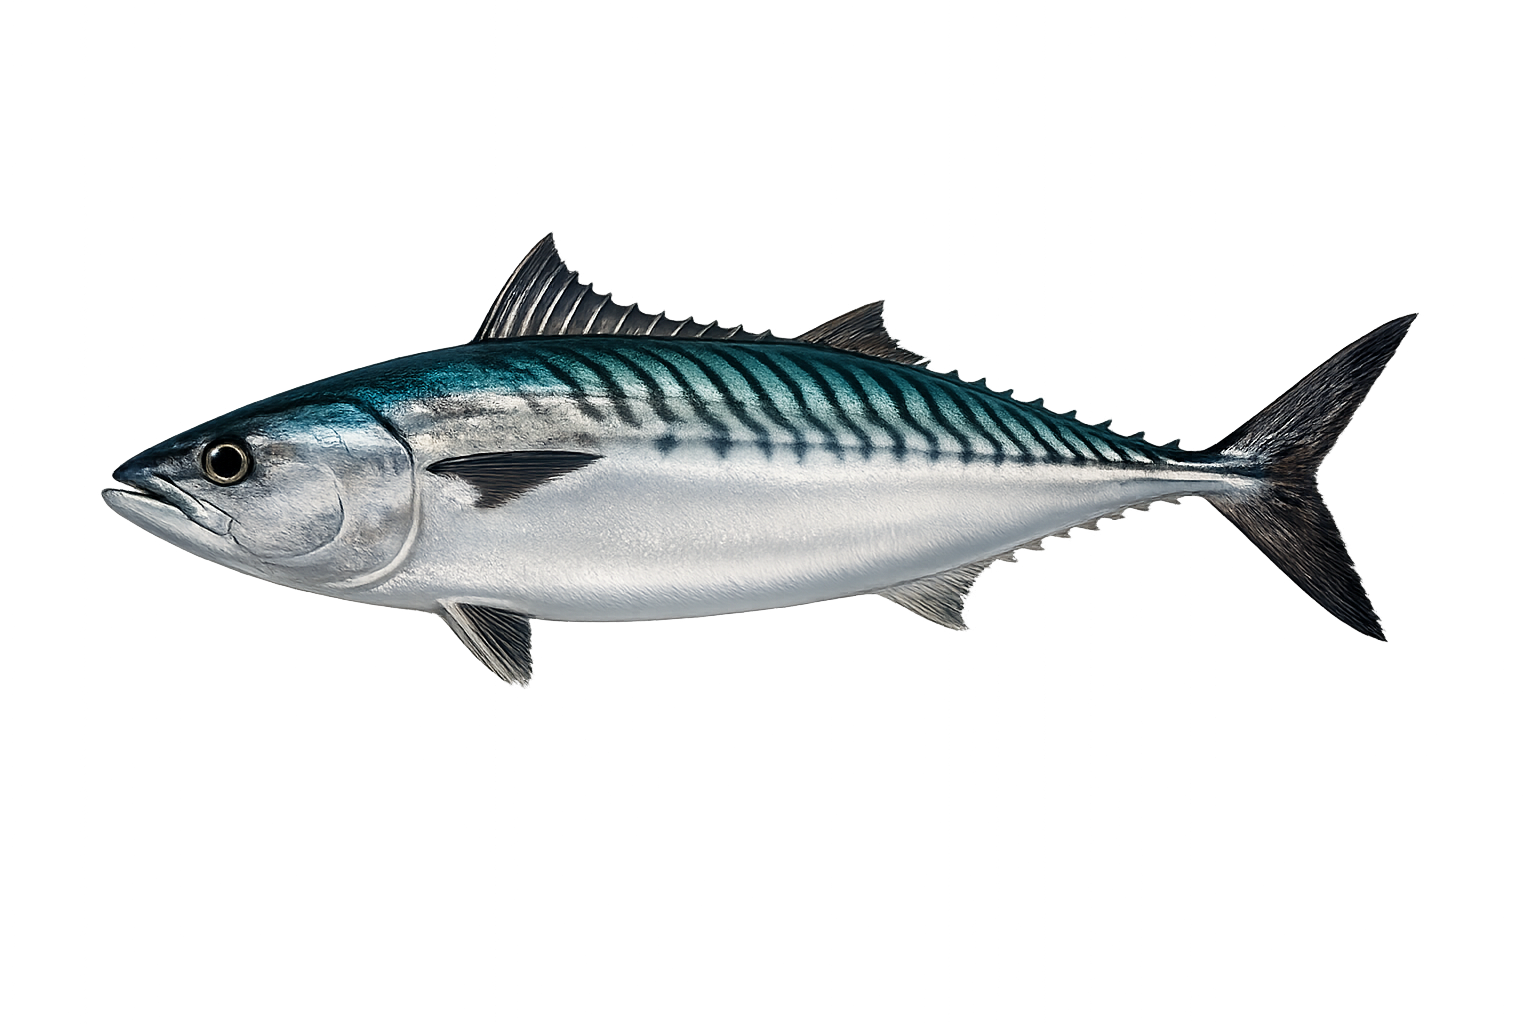
Pacific Bonito: fish landed by month, 2025 versus 2026 so far. 2025 peak December, 9,111 fish.
- 2025
- 15,236 fish
- 2026 so far
- 40,835 fish
Peak: Dec (31.2%) · Core months: Nov–Dec · Sample: 29,436 fish landed over 3 years
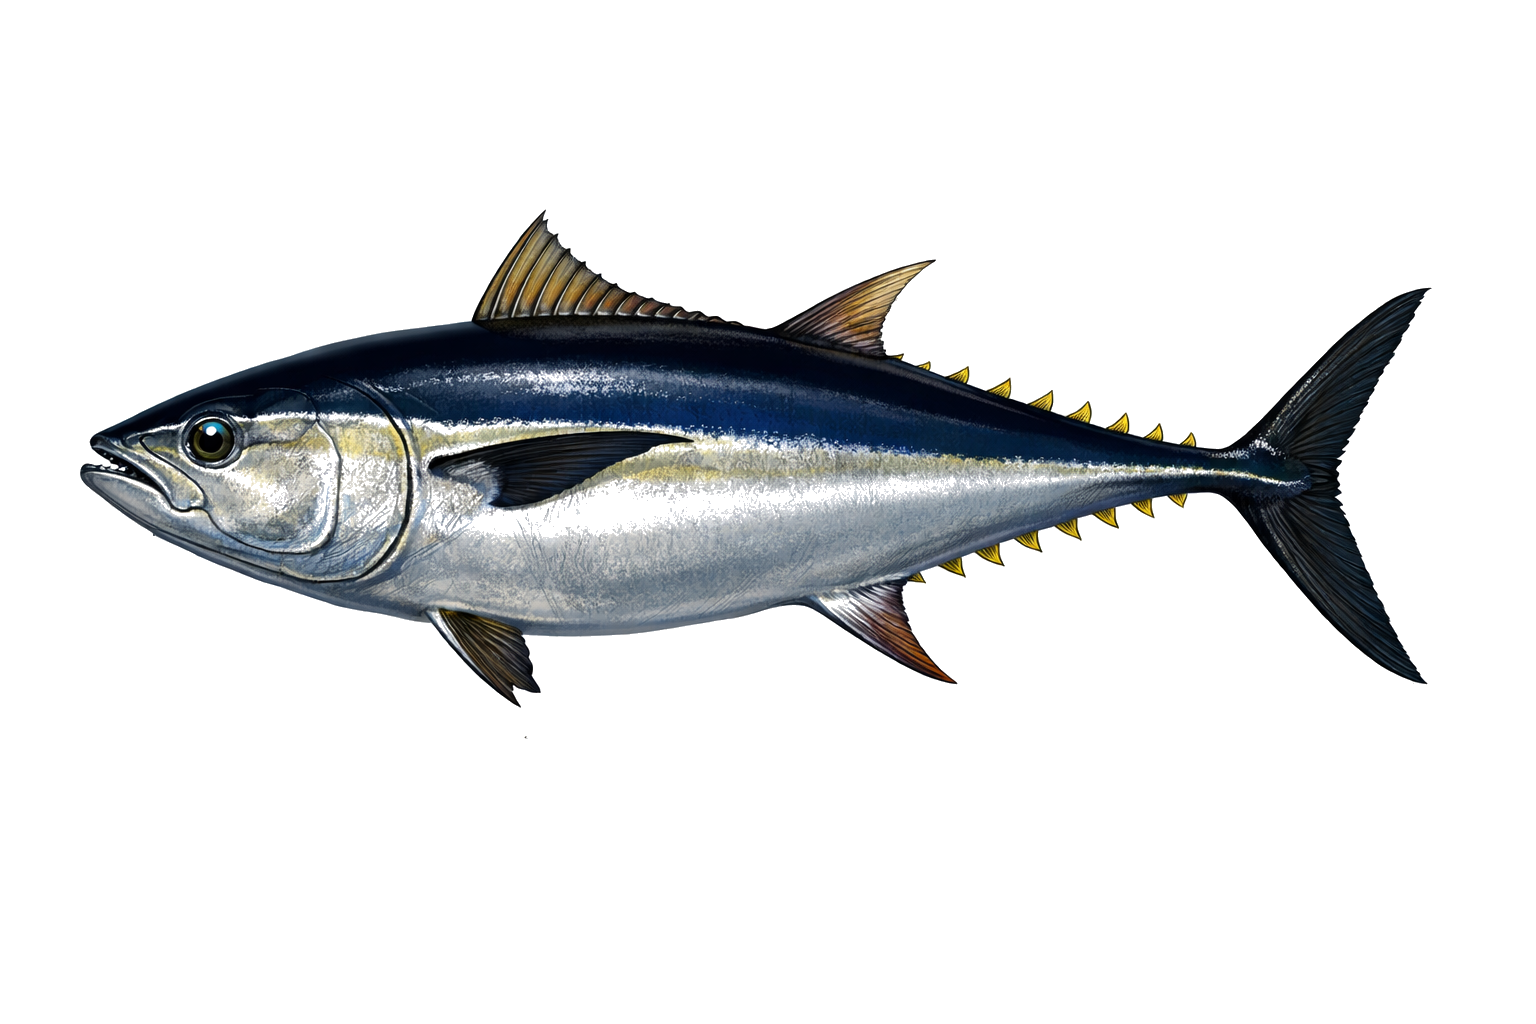
Bluefin Tuna: fish landed by month, 2025 versus 2026 so far. 2025 peak July, 11,134 fish.
- 2025
- 49,893 fish
- 2026 so far
- 30,583 fish
Peak: Sep (22.4%) · Core months: May–Oct · Sample: 157,966 fish landed over 3 years
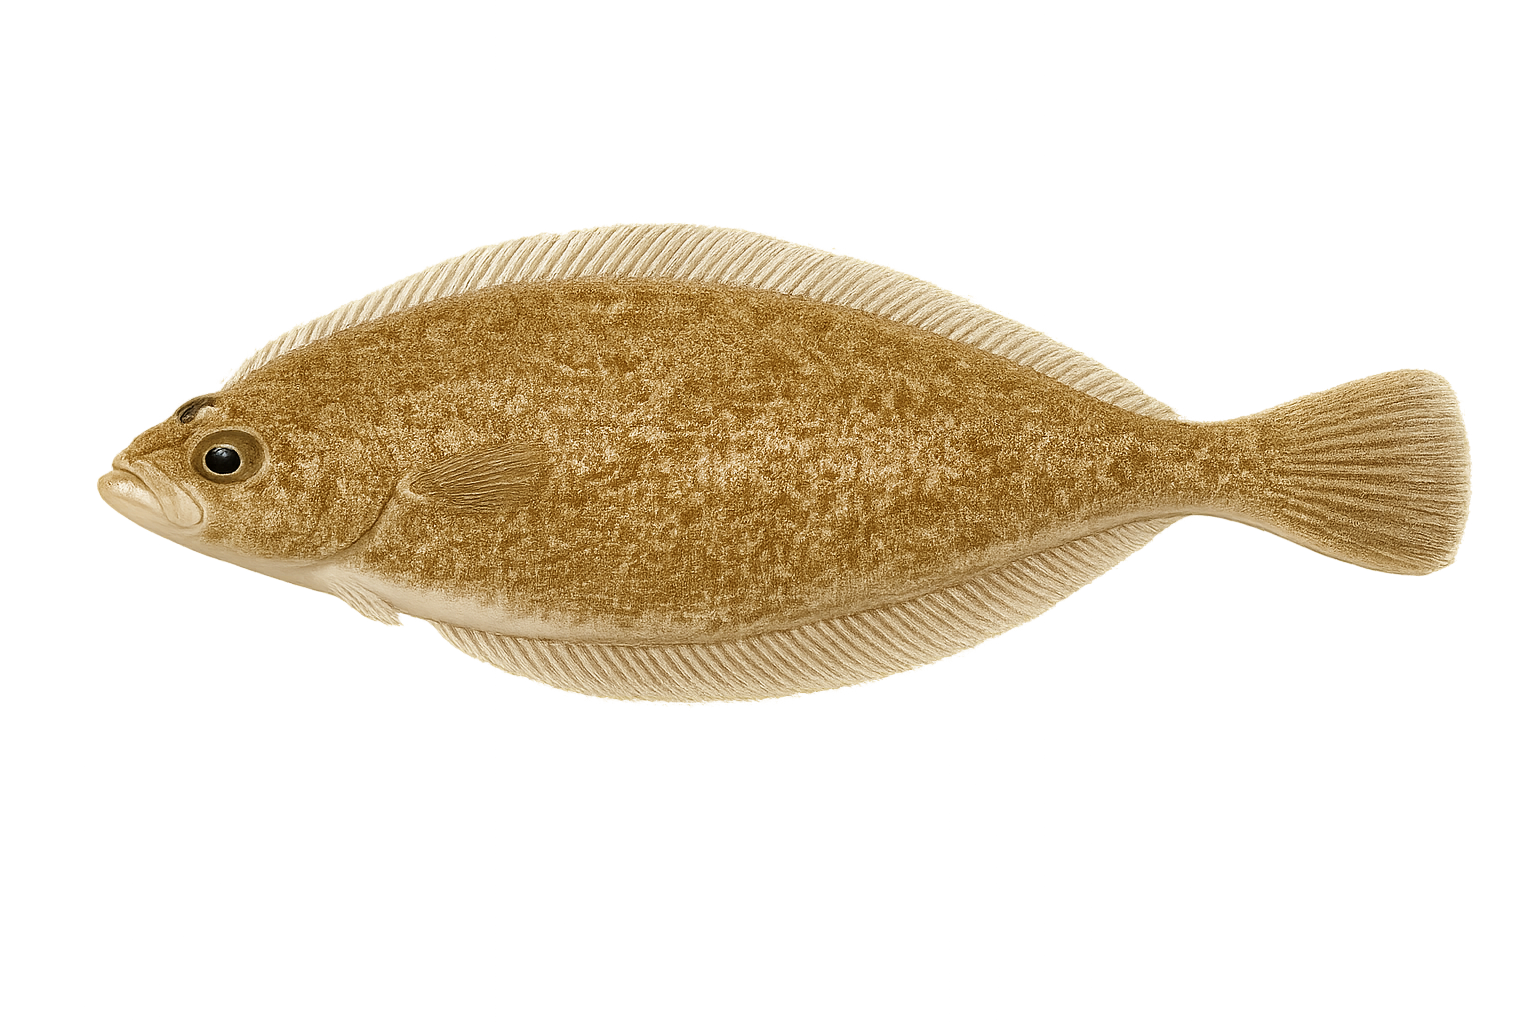
Pacific Sanddab: fish landed by month, 2025 versus 2026 so far. 2025 peak September, 160 fish.
- 2025
- 349 fish
- 2026 so far
- 11 fish
Peak: Oct (33%) · Core months: Aug–Oct · Sample: 968 fish landed over 3 years
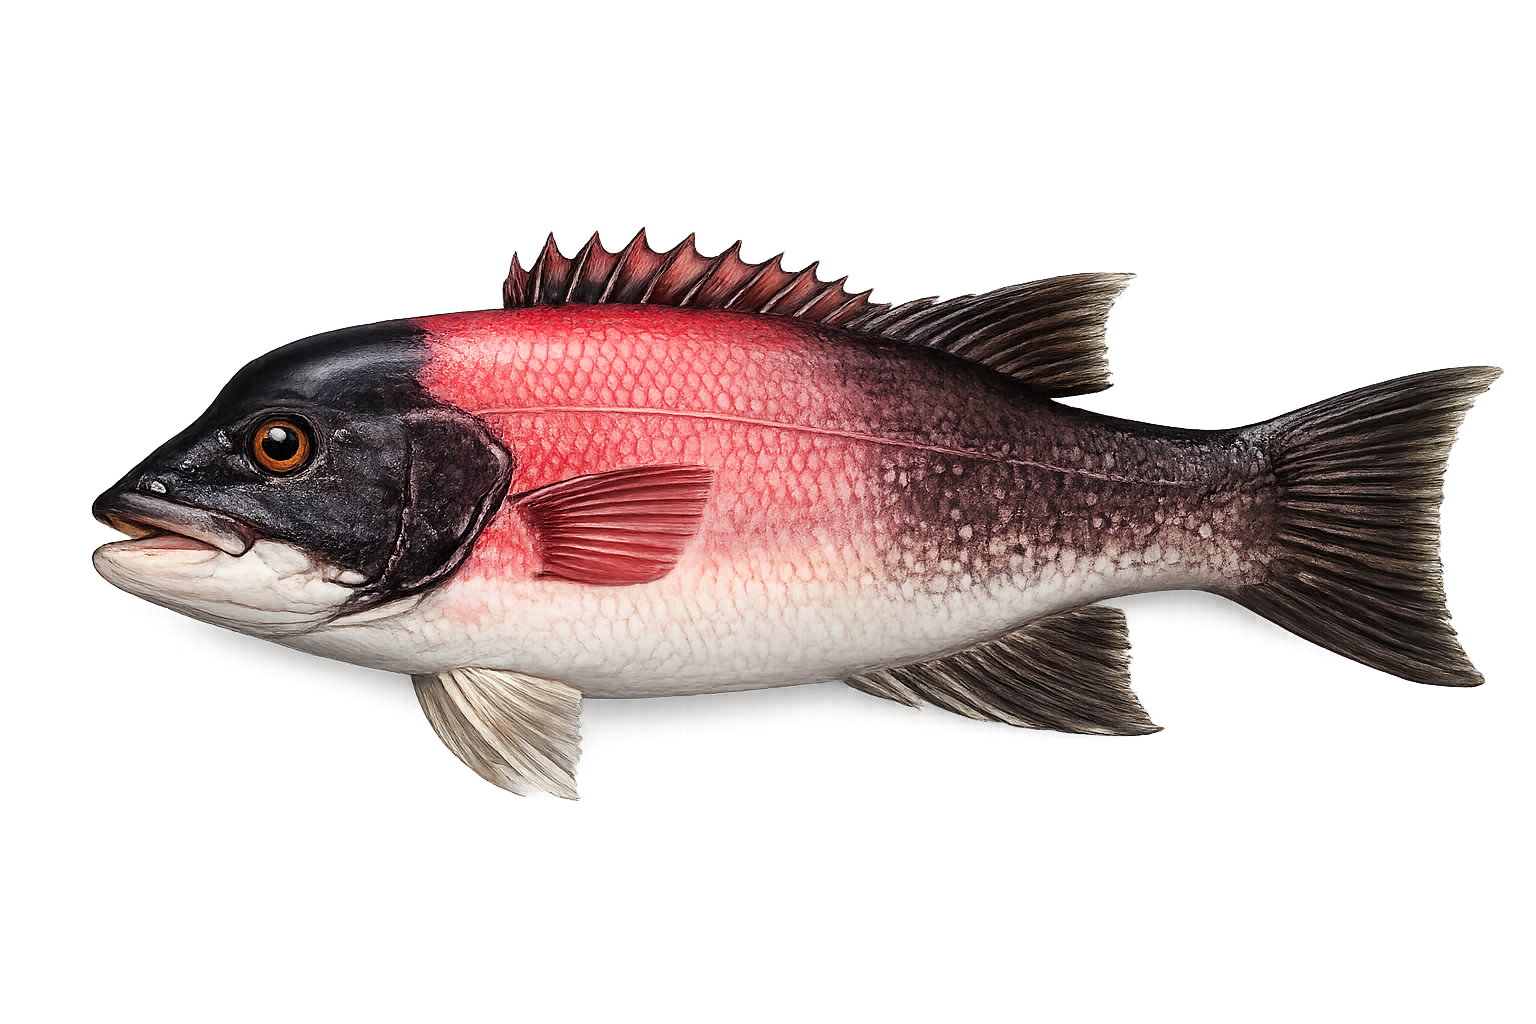
California Sheephead: fish landed by month, 2025 versus 2026 so far. 2025 peak September, 622 fish.
- 2025
- 3,329 fish
- 2026 so far
- 3,951 fish
Peak: Sep (19.8%) · Core months: May–Dec · Sample: 7,884 fish landed over 3 years
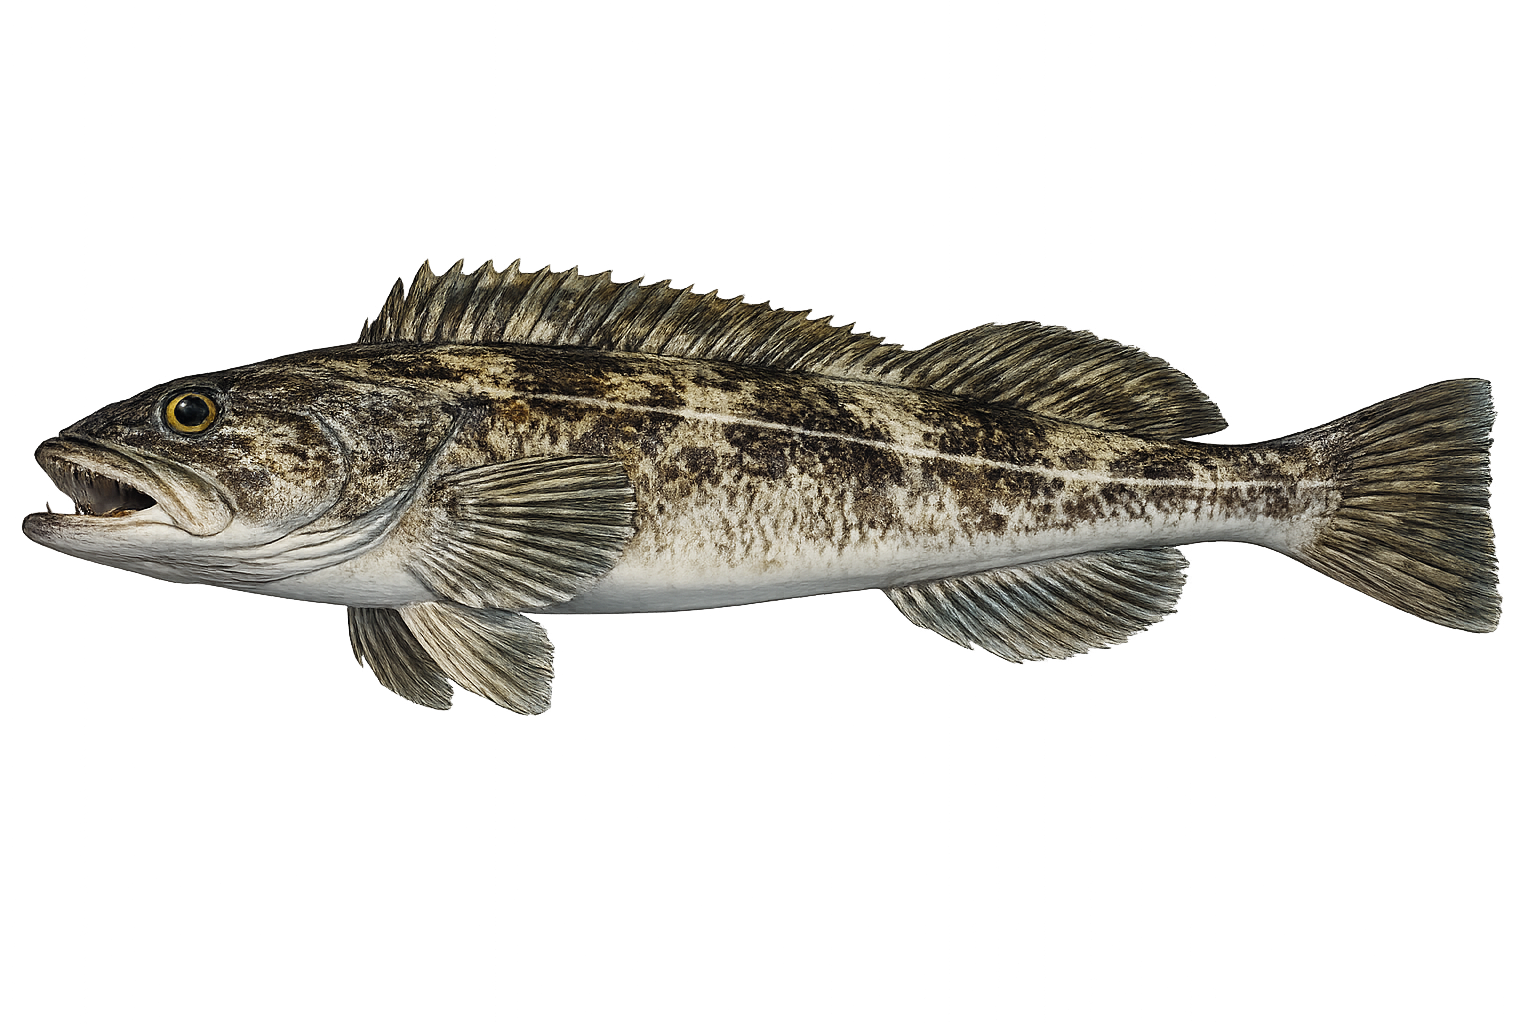
Lingcod: fish landed by month, 2025 versus 2026 so far. 2025 peak March, 413 fish.
- 2025
- 1,808 fish
- 2026 so far
- 1,743 fish
Peak: Mar (18.7%) · Core months: Jan–Apr · Sample: 3,620 fish landed over 3 years
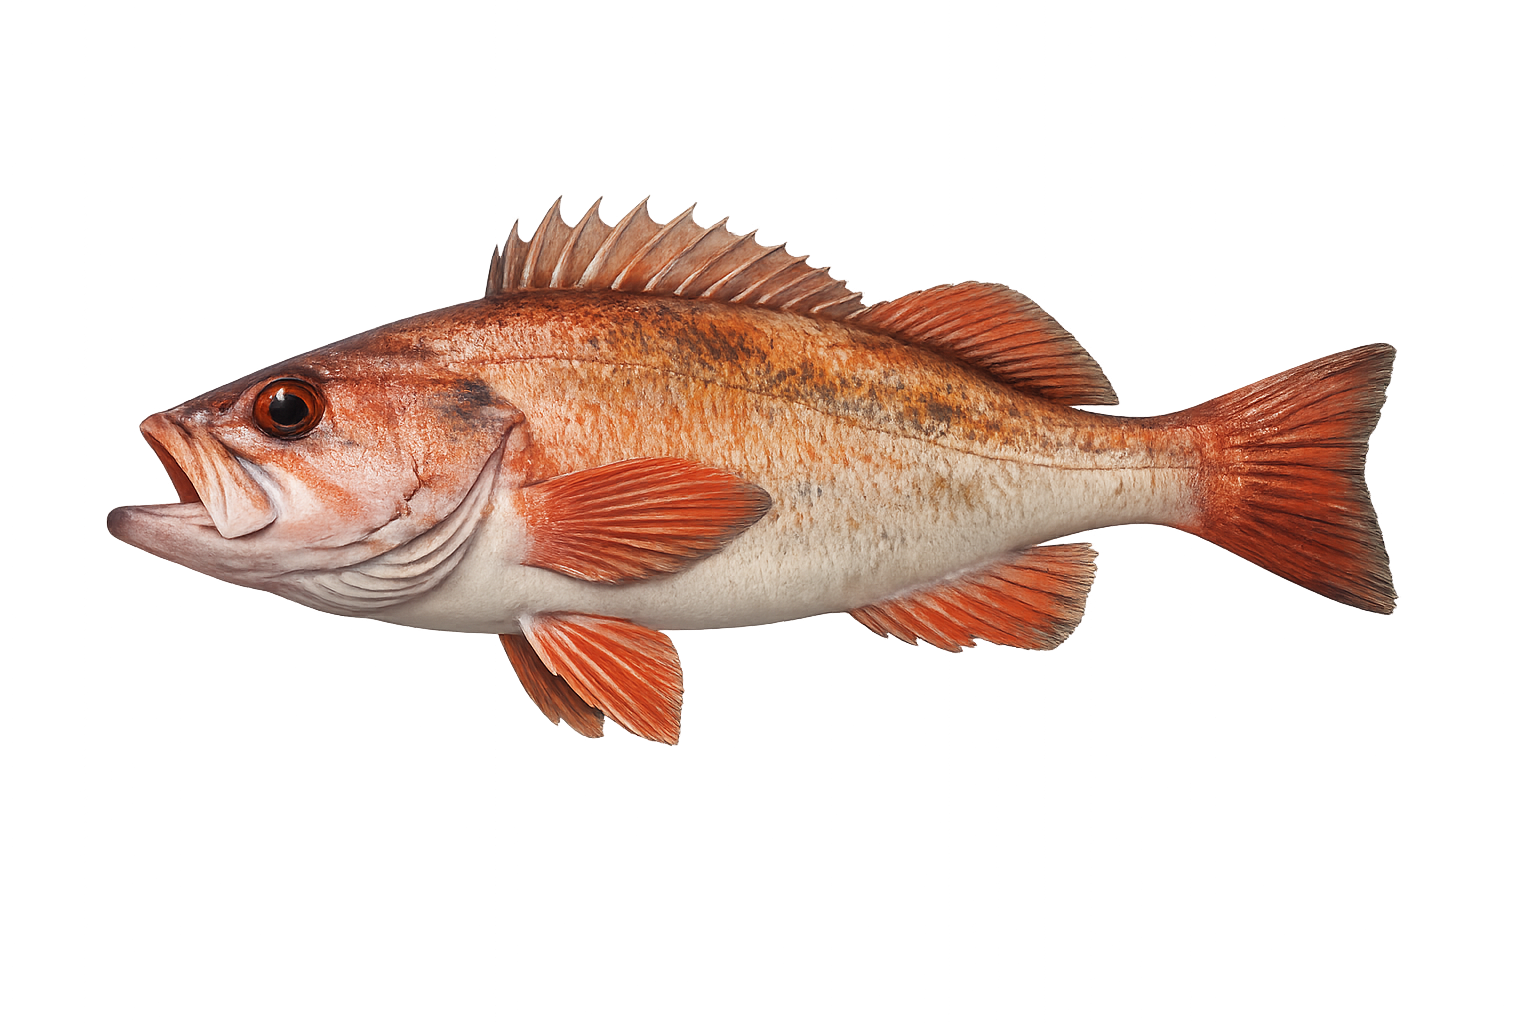
Bocaccio: fish landed by month, 2025 versus 2026 so far. 2025 peak April, 91 fish.
- 2025
- 285 fish
- 2026 so far
- 7 fish
Peak: May (18.6%) · Core months: Apr–Oct · Sample: 1,767 fish landed over 3 years
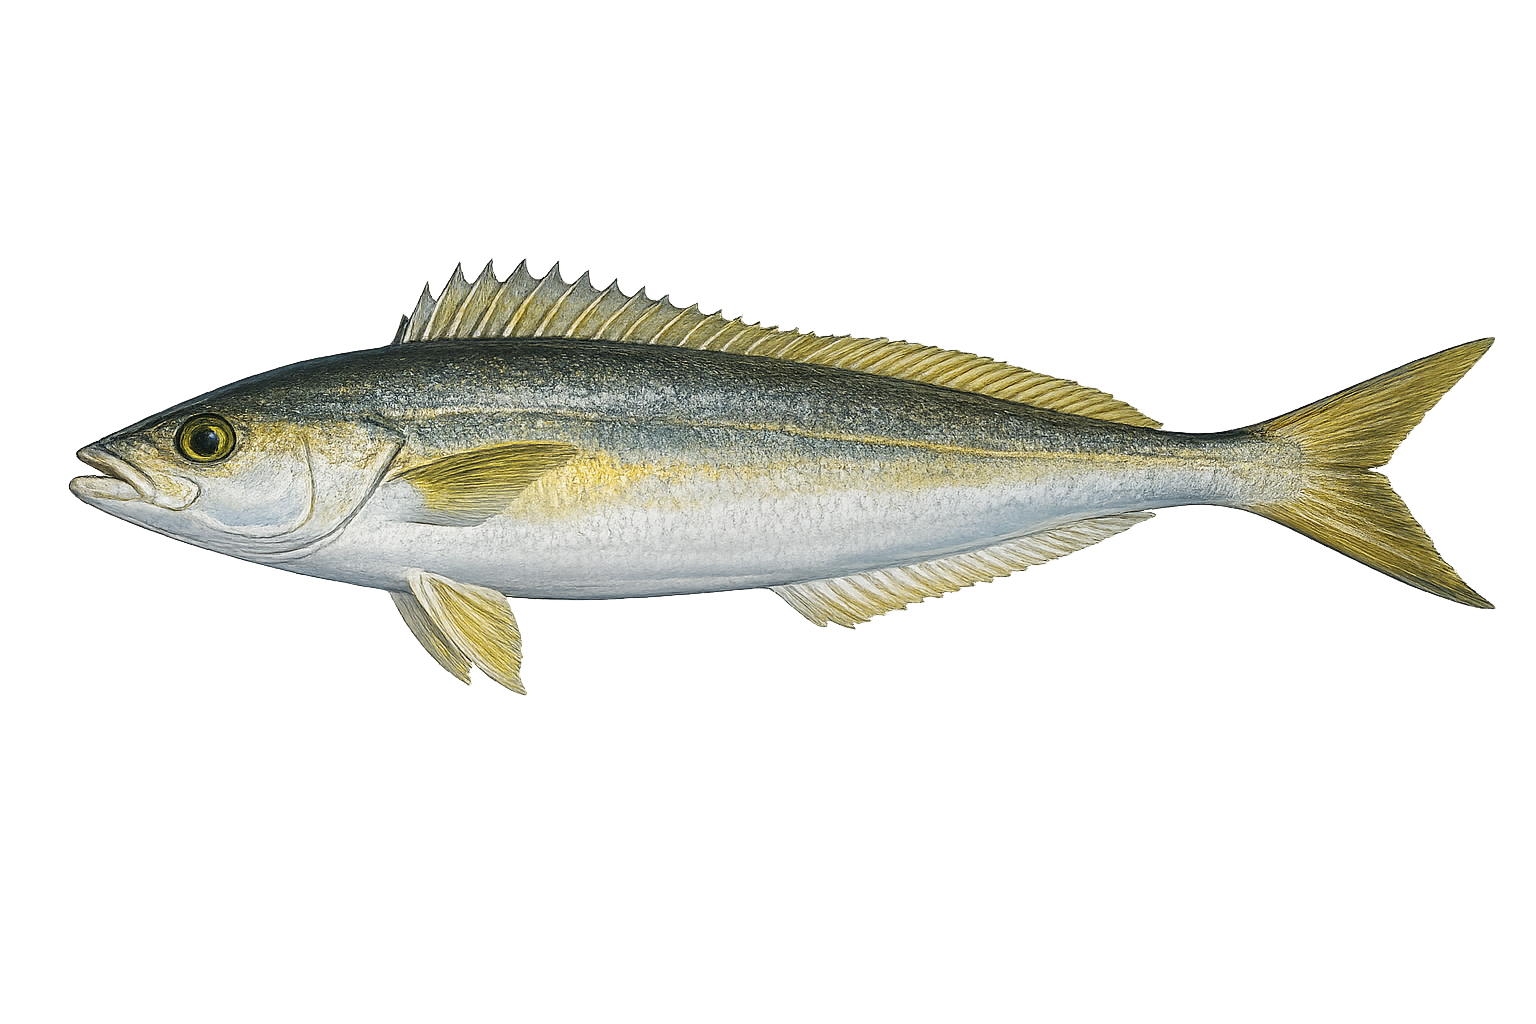
Ocean Whitefish: fish landed by month, 2025 versus 2026 so far. 2025 peak August, 5,861 fish.
- 2025
- 23,603 fish
- 2026 so far
- 17,044 fish
Peak: Mar (15.6%) · Core months: Jan–Jun · Sample: 48,256 fish landed over 3 years
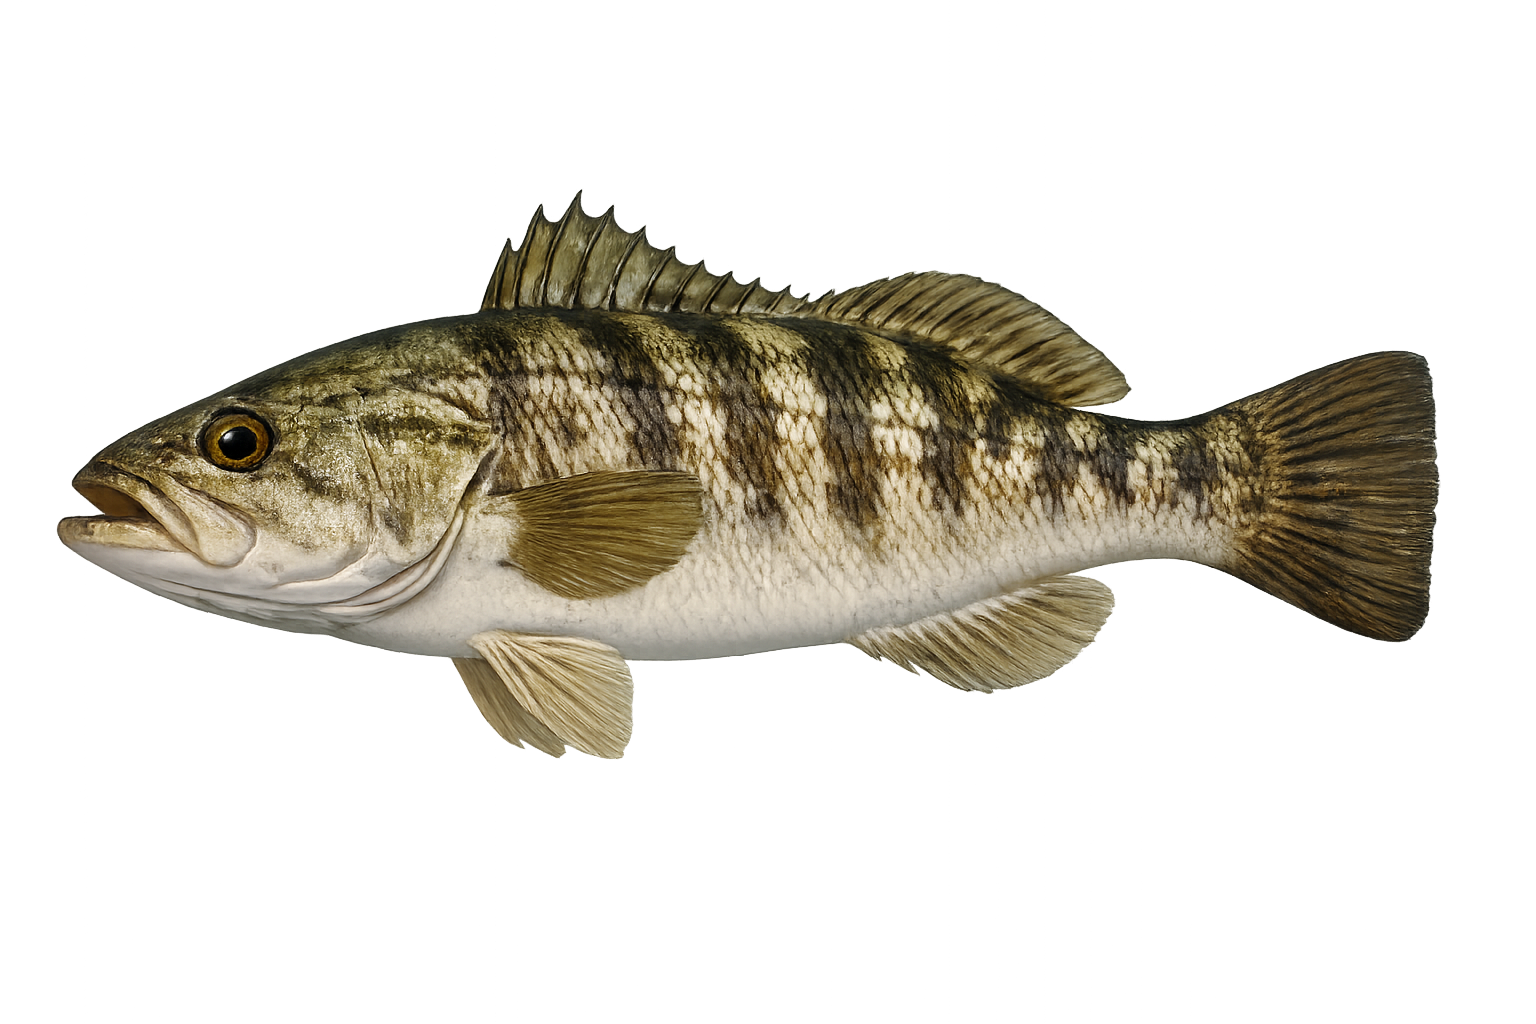
Calico Bass: fish landed by month, 2025 versus 2026 so far. 2025 peak June, 18,319 fish.
- 2025
- 43,866 fish
- 2026 so far
- 69,190 fish
Peak: Jun (28%) · Core months: May–Sep · Sample: 113,864 fish landed over 3 years
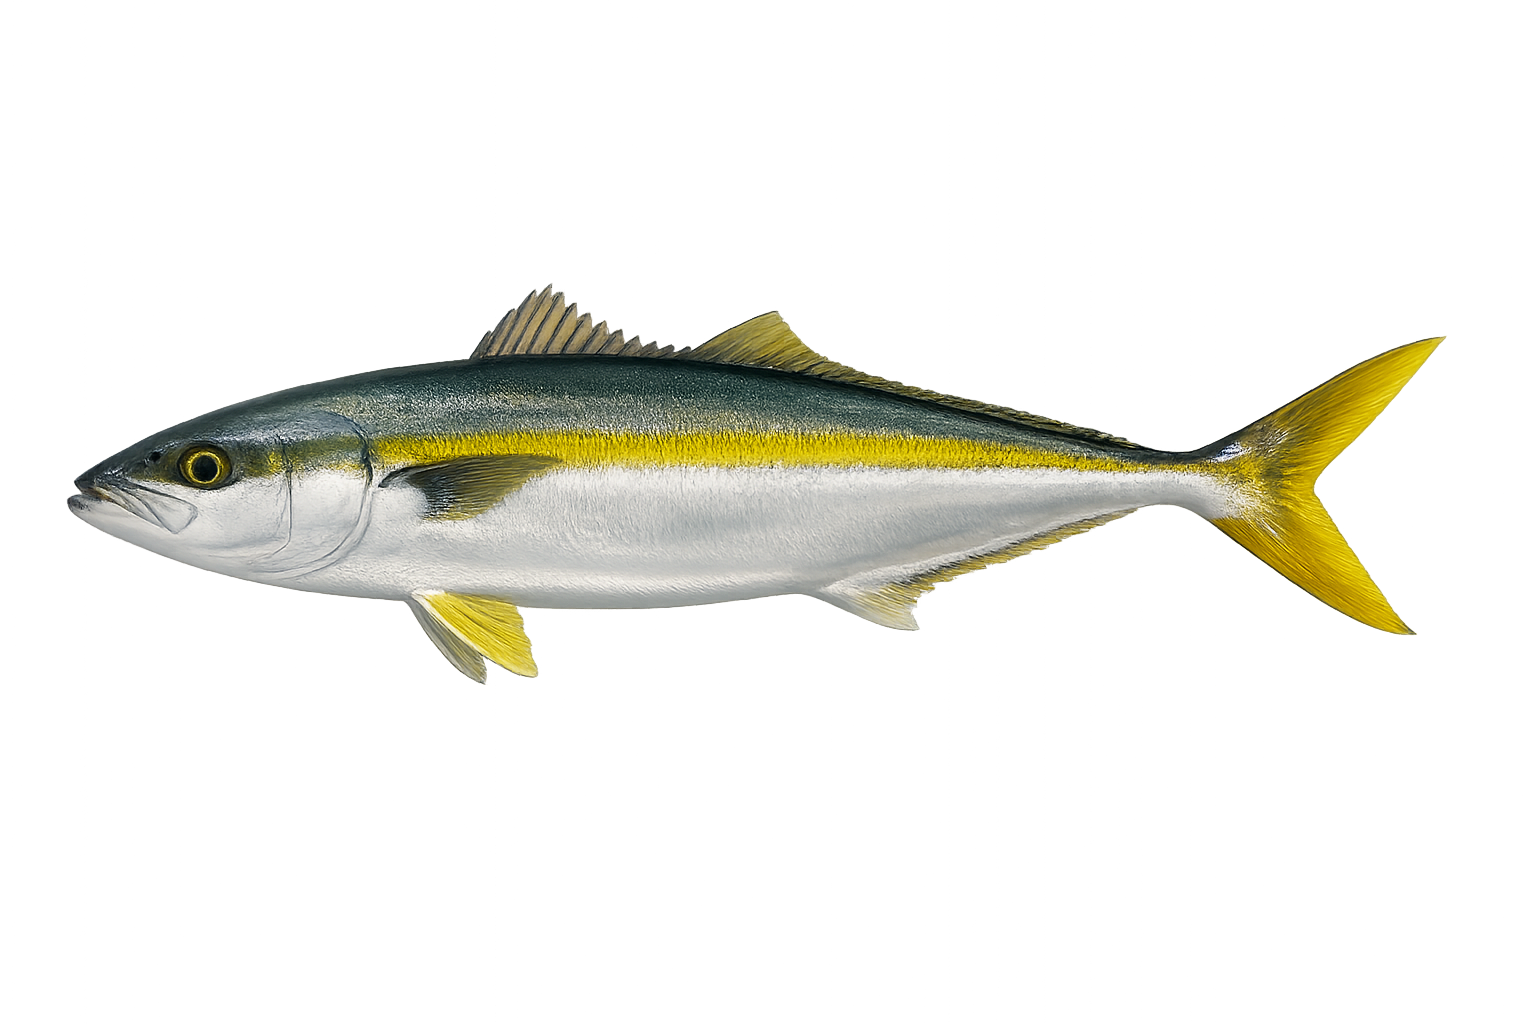
Yellowtail: fish landed by month, 2025 versus 2026 so far. 2025 peak August, 6,913 fish.
- 2025
- 20,698 fish
- 2026 so far
- 39,740 fish
Peak: Aug (36%) · Core months: Jul–Oct · Sample: 64,227 fish landed over 3 years
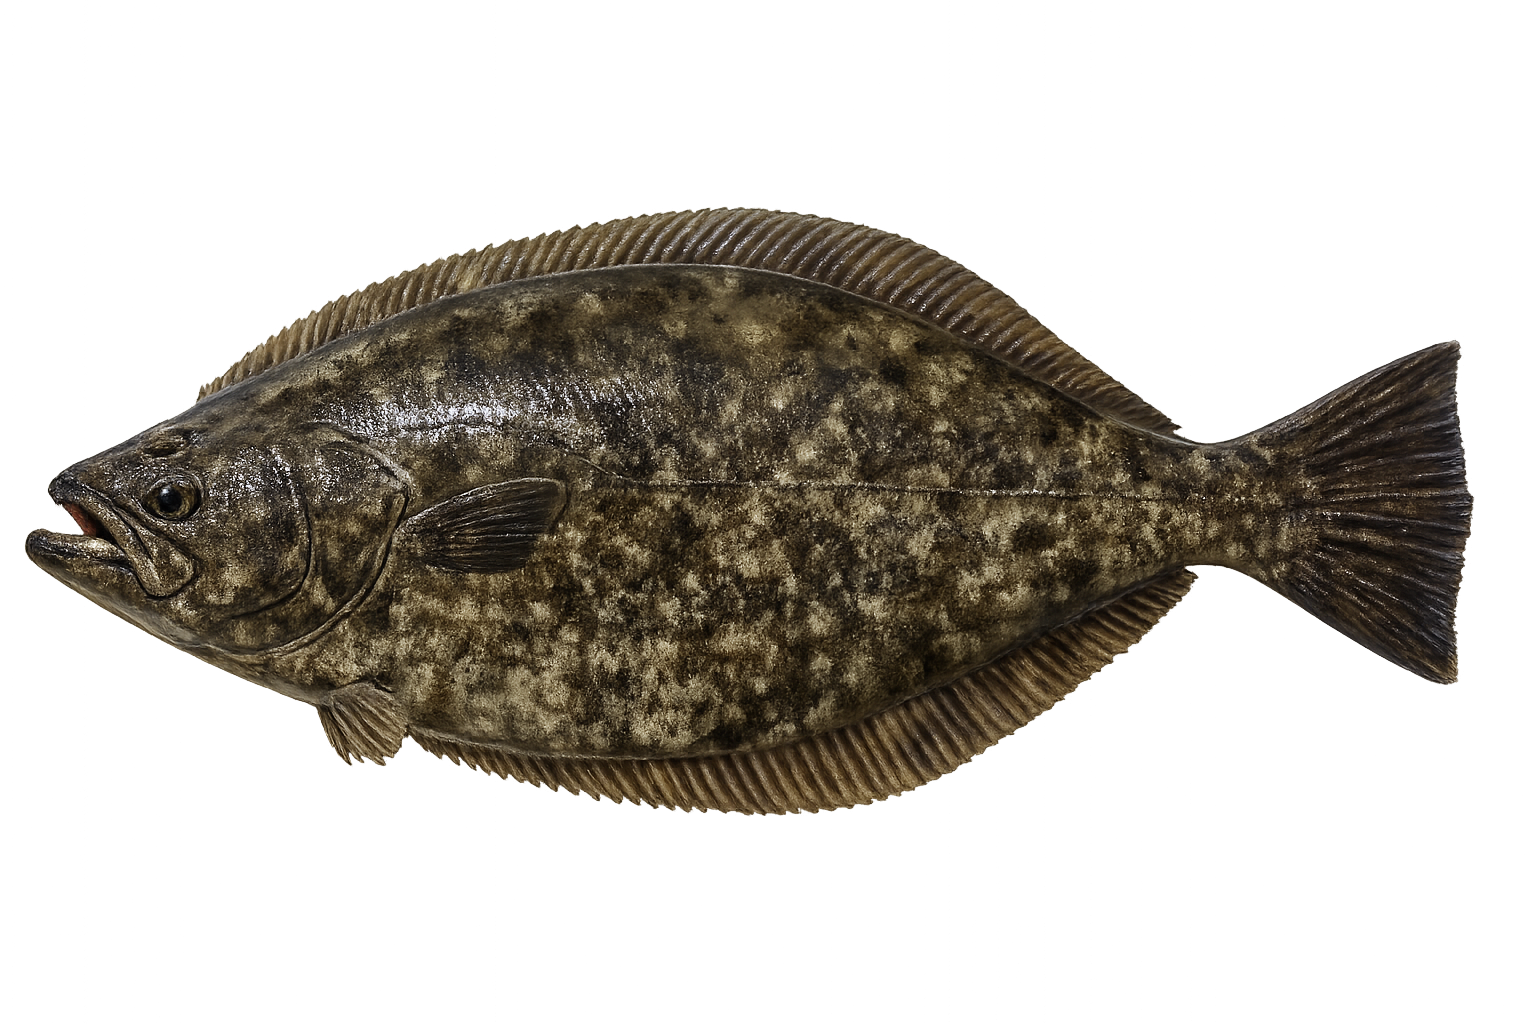
California Halibut: fish landed by month, 2025 versus 2026 so far. 2025 peak June, 190 fish.
- 2025
- 837 fish
- 2026 so far
- 331 fish
Peak: Mar (17.9%) · Core months: Jan–Sep · Sample: 1,519 fish landed over 3 years
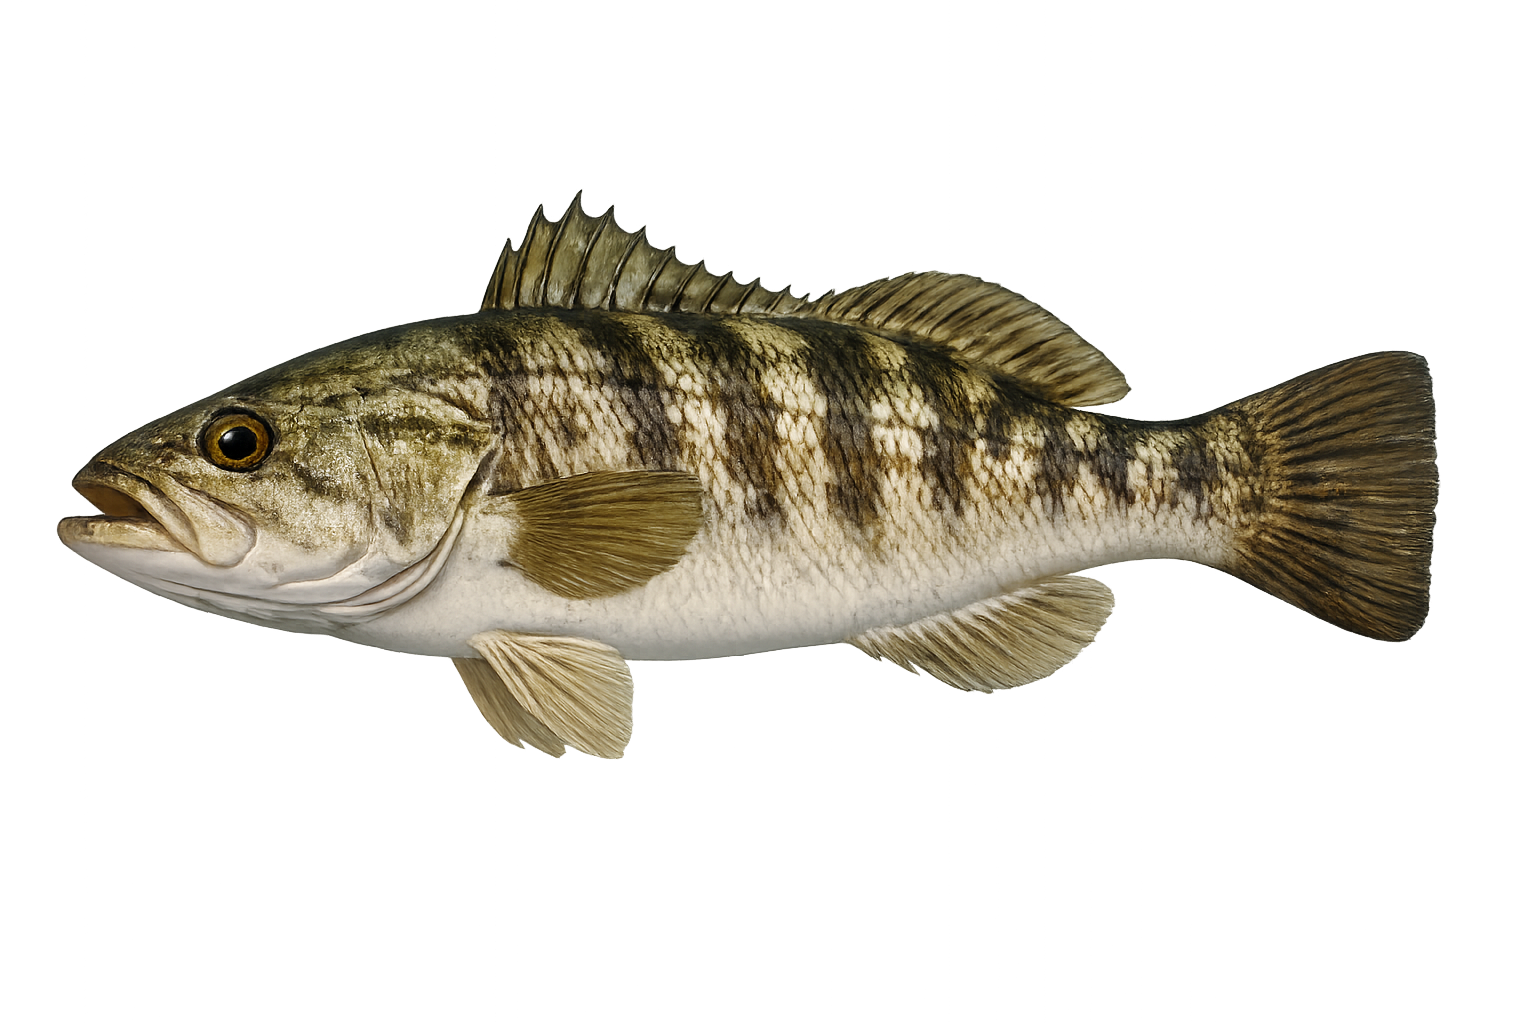
Sand Bass (Barred Sand Bass): fish landed by month, 2025 versus 2026 so far. 2025 peak July, 9,126 fish.
- 2025
- 19,350 fish
- 2026 so far
- 15,411 fish
Peak: Jul (34.5%) · Core months: Jun–Sep · Sample: 41,442 fish landed over 3 years

Brown Rock Crab: fish landed by month, 2025 versus 2026 so far. 2025 peak October, 405 fish.
- 2025
- 971 fish
- 2026 so far
- 148 fish
Peak: Oct (42.9%) · Core months: Oct–Feb · Sample: 2,822 fish landed over 3 years
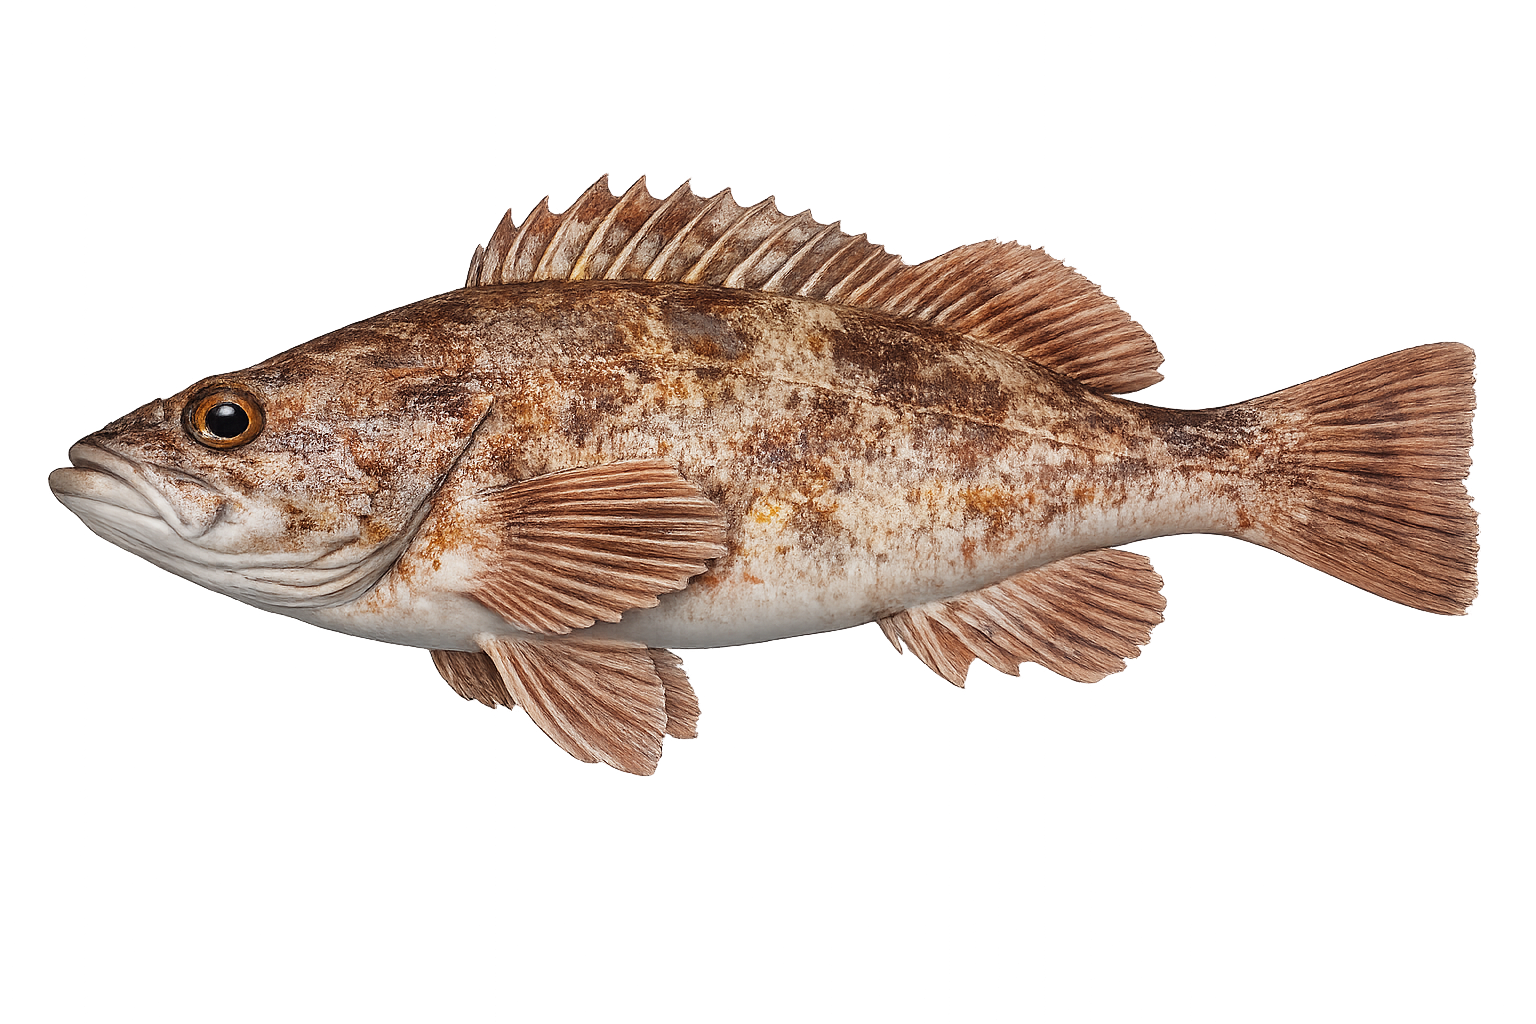
Rockfish: fish landed by month, 2025 versus 2026 so far. 2025 peak October, 16,996 fish.
- 2025
- 91,833 fish
- 2026 so far
- 60,201 fish
Peak: Oct (15.3%) · Core months: Apr–Dec · Sample: 304,267 fish landed over 3 years
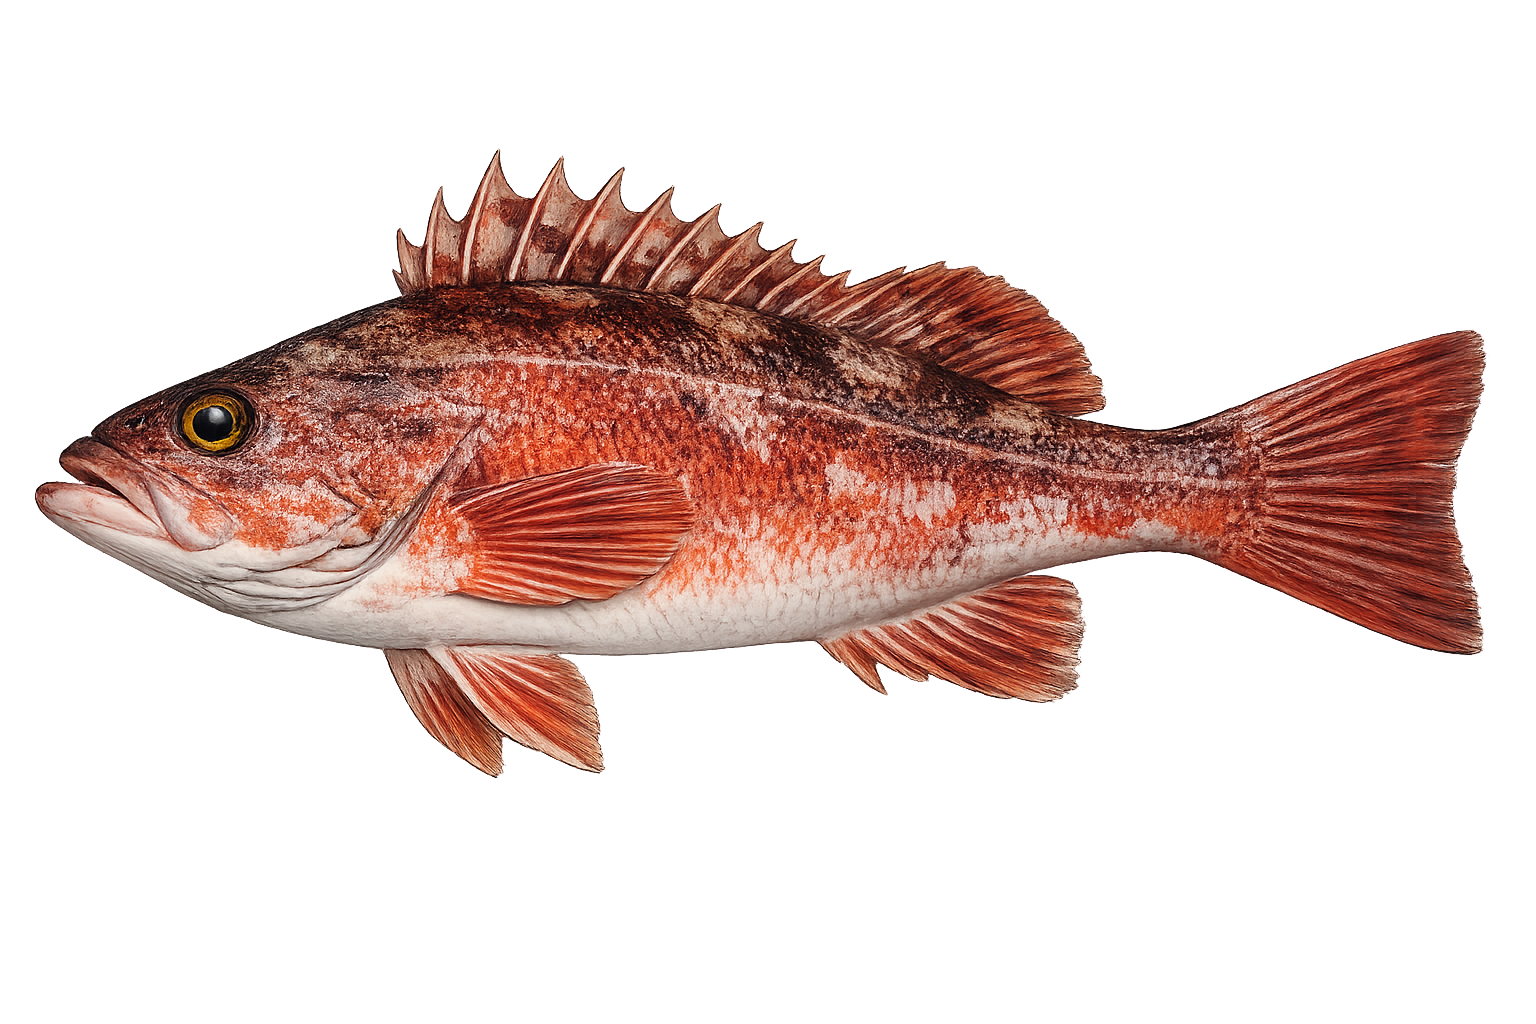
Vermilion Rockfish (Reds): fish landed by month, 2025 versus 2026 so far. 2025 peak June, 1,168 fish.
- 2025
- 5,326 fish
- 2026 so far
- 6,716 fish
Peak: Apr (25.6%) · Core months: Apr–Jul · Sample: 17,280 fish landed over 3 years
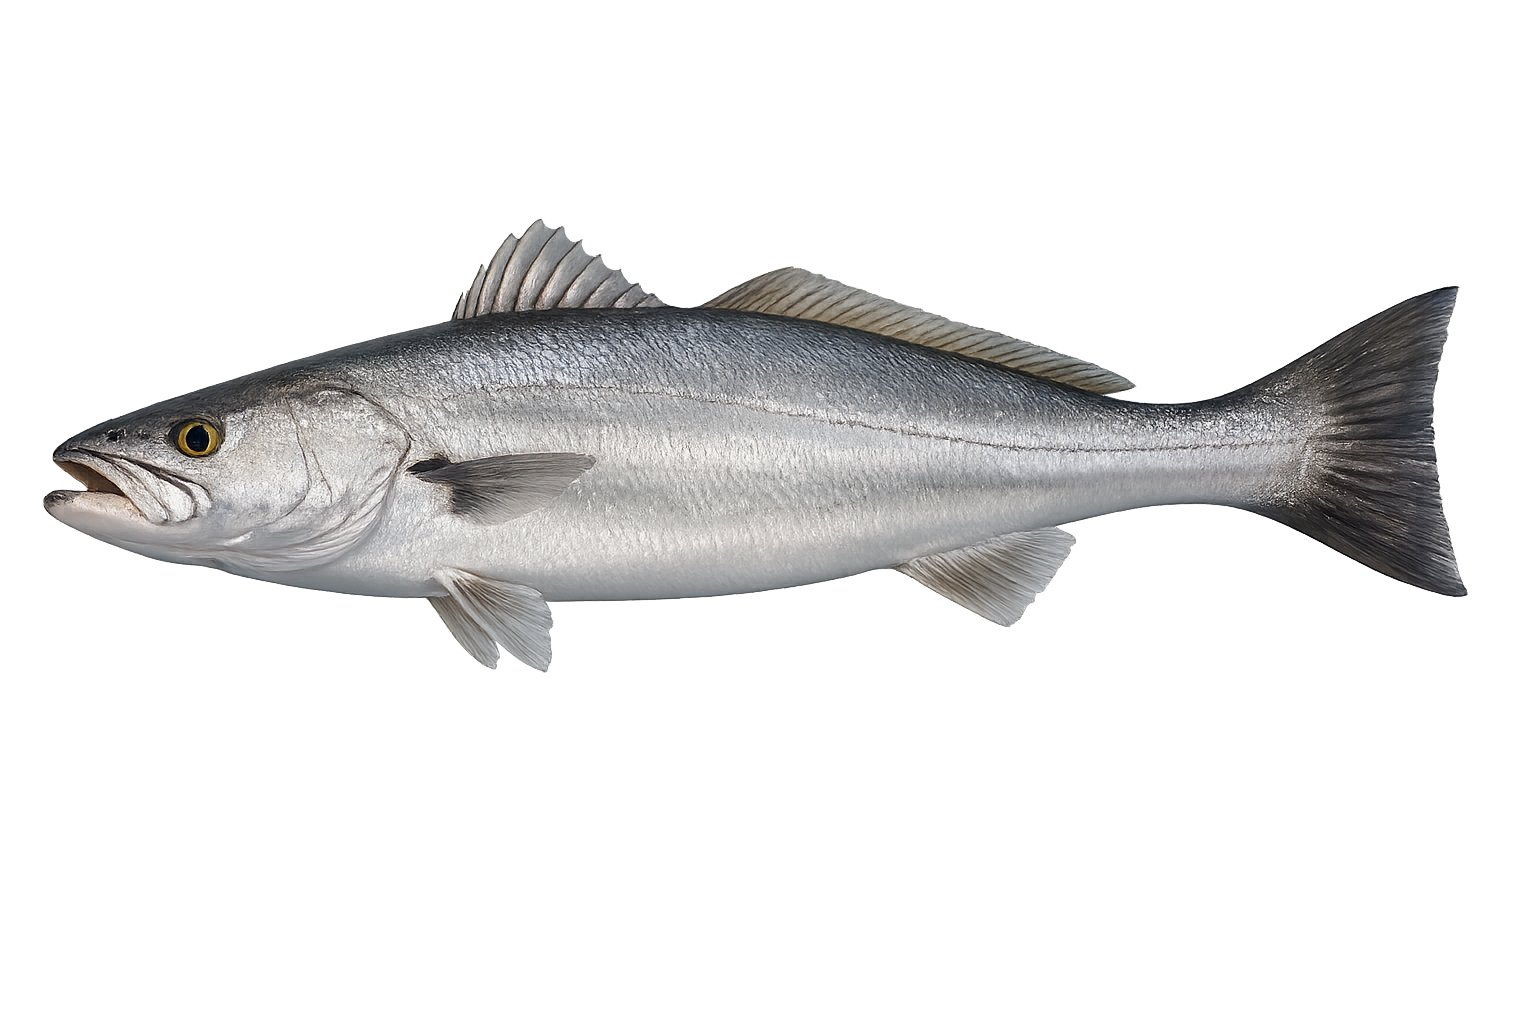
White Seabass: fish landed by month, 2025 versus 2026 so far. 2025 peak June, 188 fish.
- 2025
- 375 fish
- 2026 so far
- 227 fish
Peak: Aug (35.3%) · Core months: May–Aug · Sample: 966 fish landed over 3 years
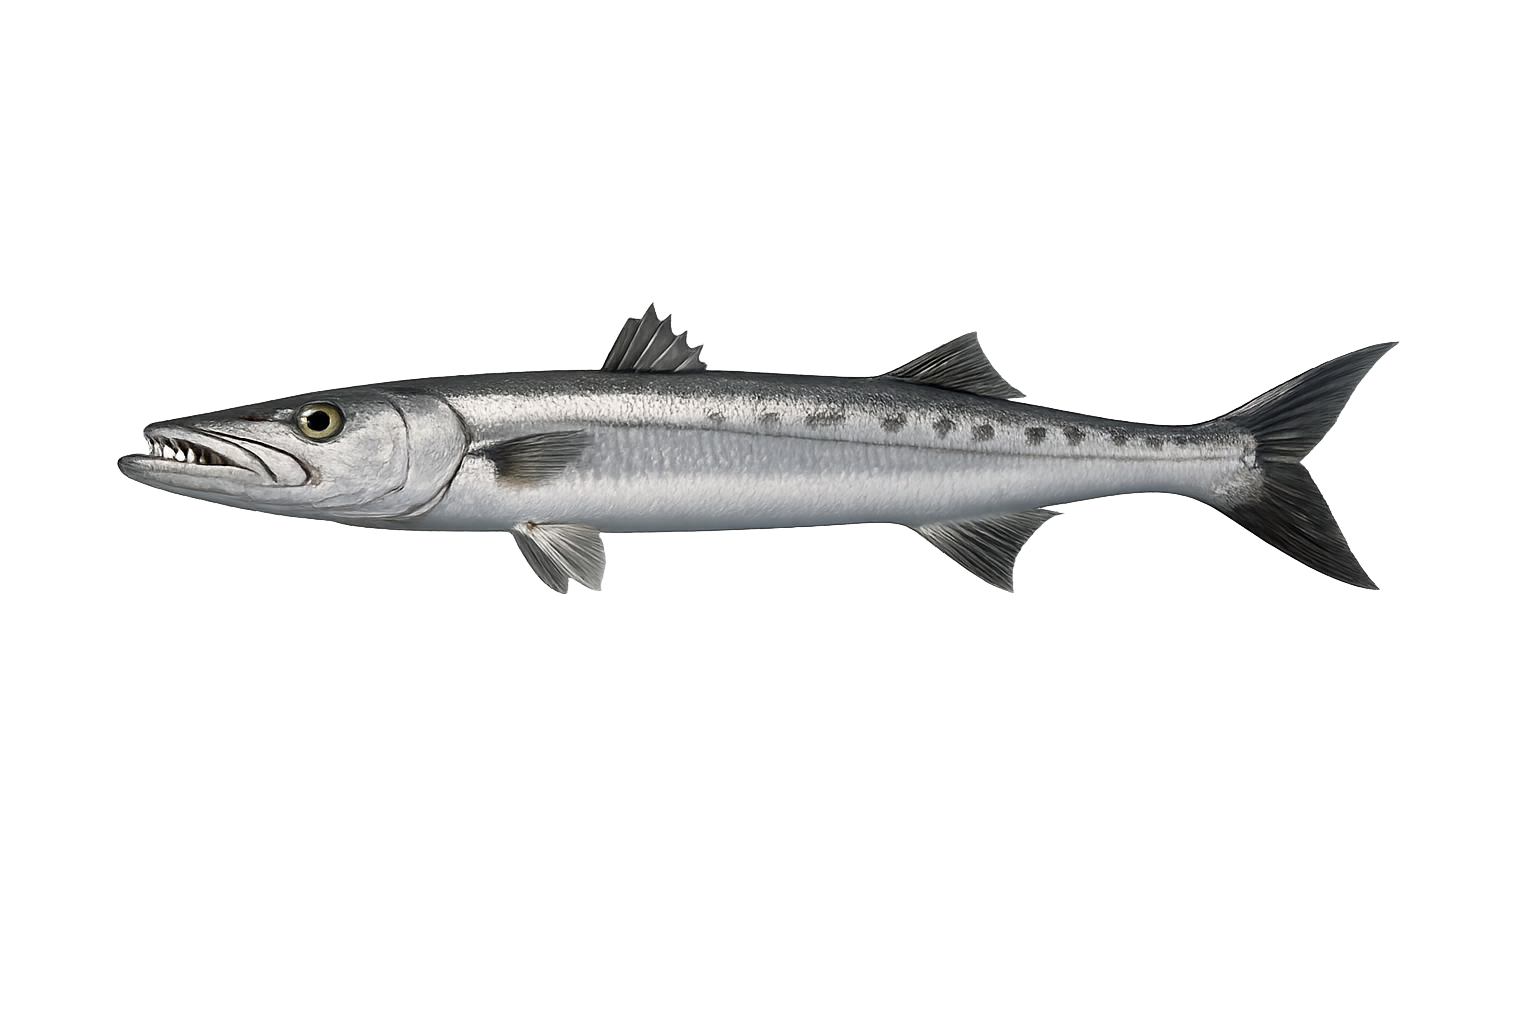
California Barracuda: fish landed by month, 2025 versus 2026 so far. 2025 peak August, 1,343 fish.
- 2025
- 2,976 fish
- 2026 so far
- 14,845 fish
Peak: Aug (36.3%) · Core months: May–Aug · Sample: 8,328 fish landed over 3 years
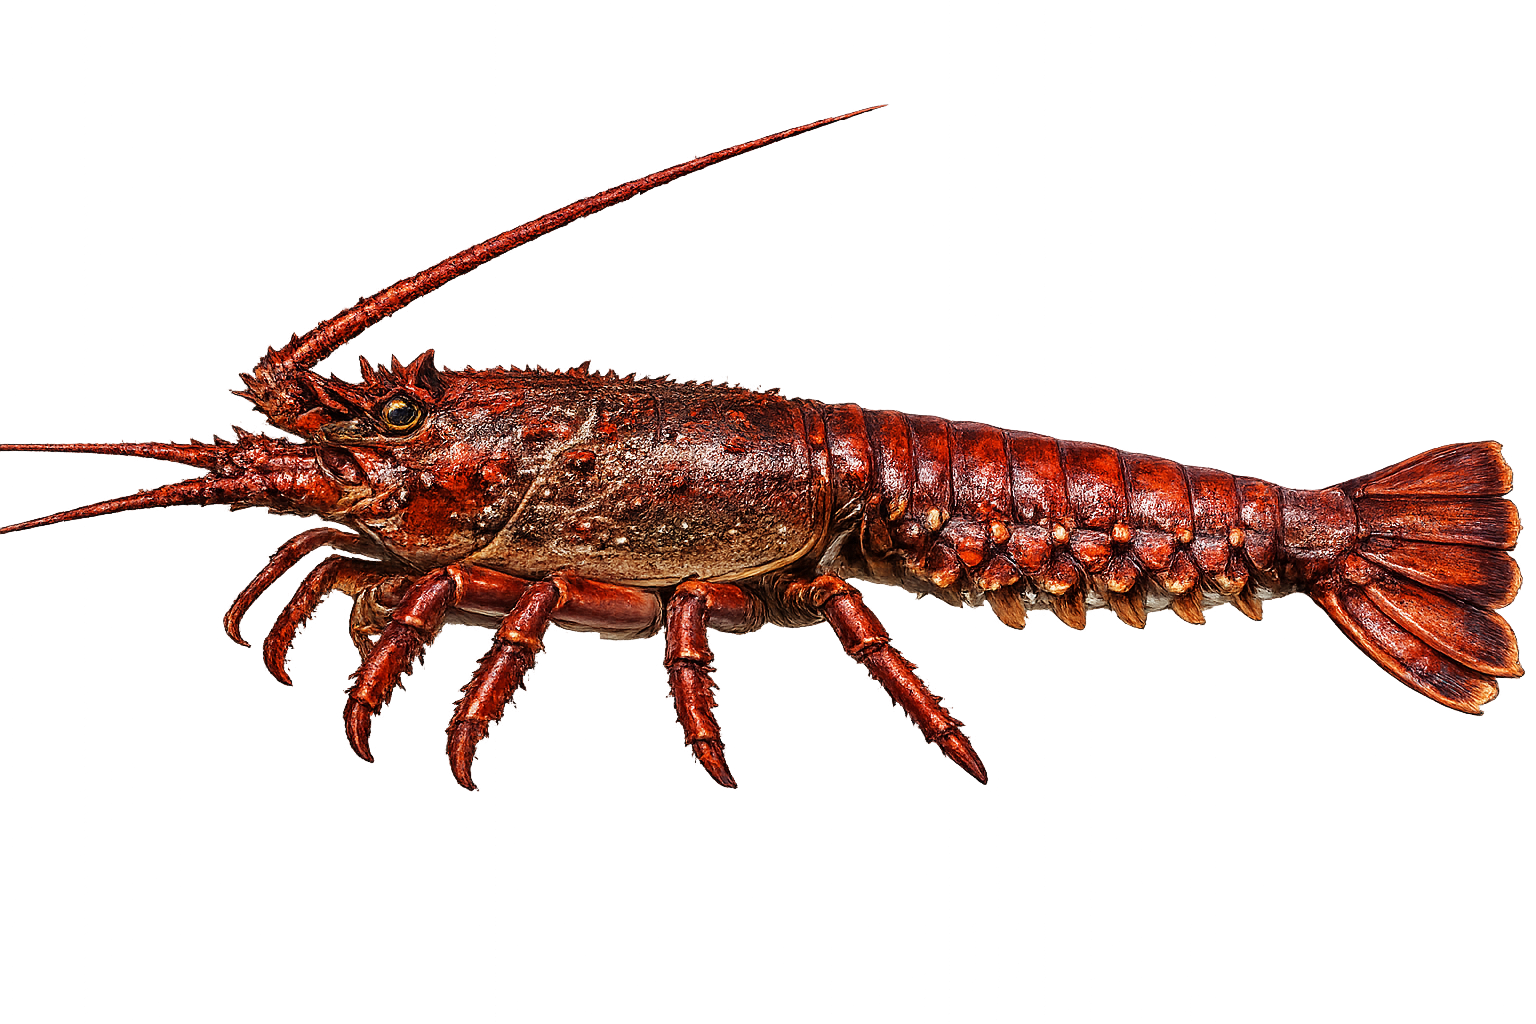
California Spiny Lobster: fish landed by month, 2025 versus 2026 so far. 2025 peak December, 1,997 fish.
- 2025
- 5,669 fish
- 2026 so far
- 2,749 fish
Peak: Oct (30.2%) · Core months: Oct–Mar · Sample: 12,784 fish landed over 3 years
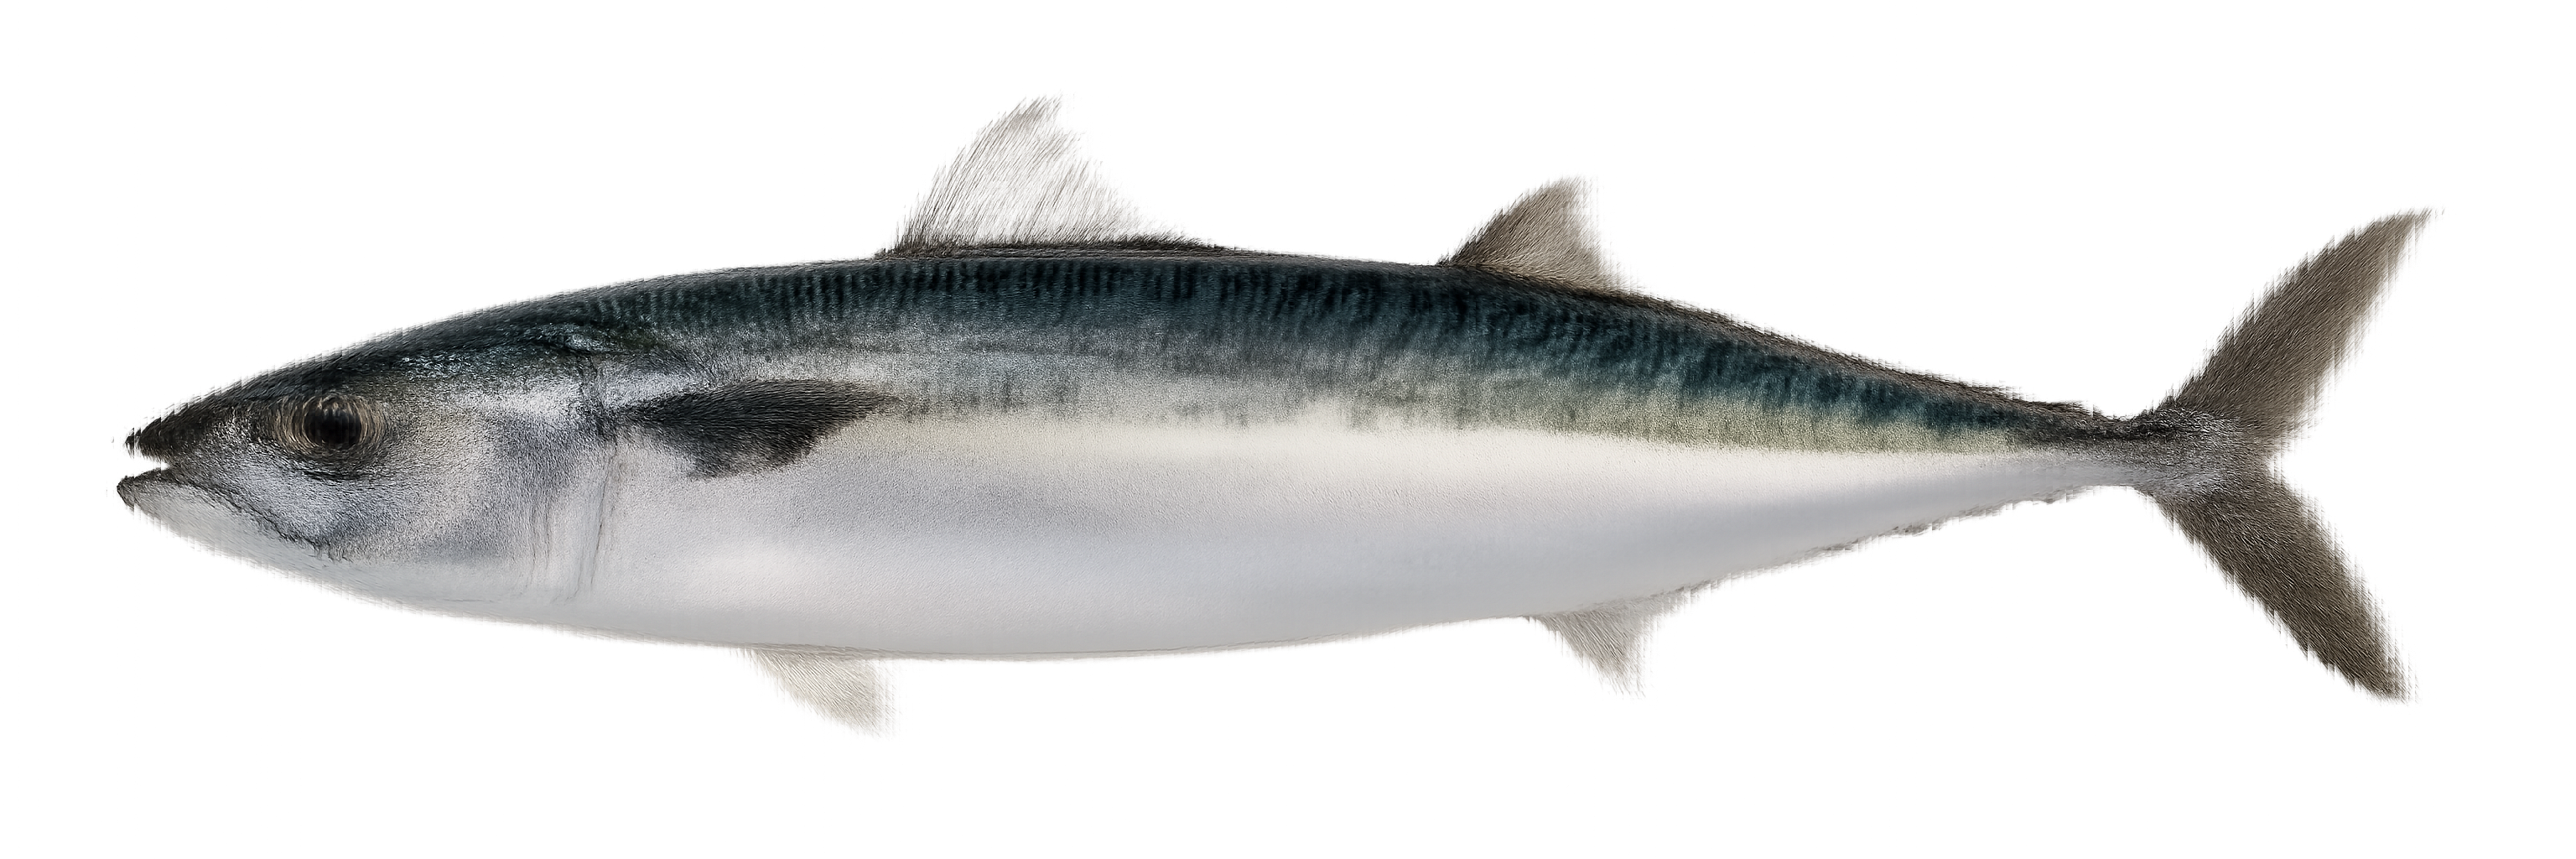
Pacific Mackerel: fish landed by month, 2025 versus 2026 so far. 2025 peak July, 117 fish.
- 2025
- 157 fish
- 2026 so far
- 27 fish
Peak: Jul (25%) · Core months: Jul–Jul · Sample: 468 fish landed over 3 years
Source: California charter dock reports, 2023–2025. Species with too few reported trips to show a reliable pattern are omitted here rather than guessed at.